Grafana support for Prometheus
Grafana is an open-source analytics and visualization platform used to monitor and analyze metrics from various data sources. It allows users to create, explore, and share interactive dashboards, supporting integrations with databases like Prometheus, InfluxDB, Elasticsearch, and more. Grafana is widely used for observability, providing alerting, plugin extensibility, and a flexible query editor for real-time data visualization.
Note: The Grafana data source for Prometheus is included since Grafana 2.5.0 (2015-10-28).
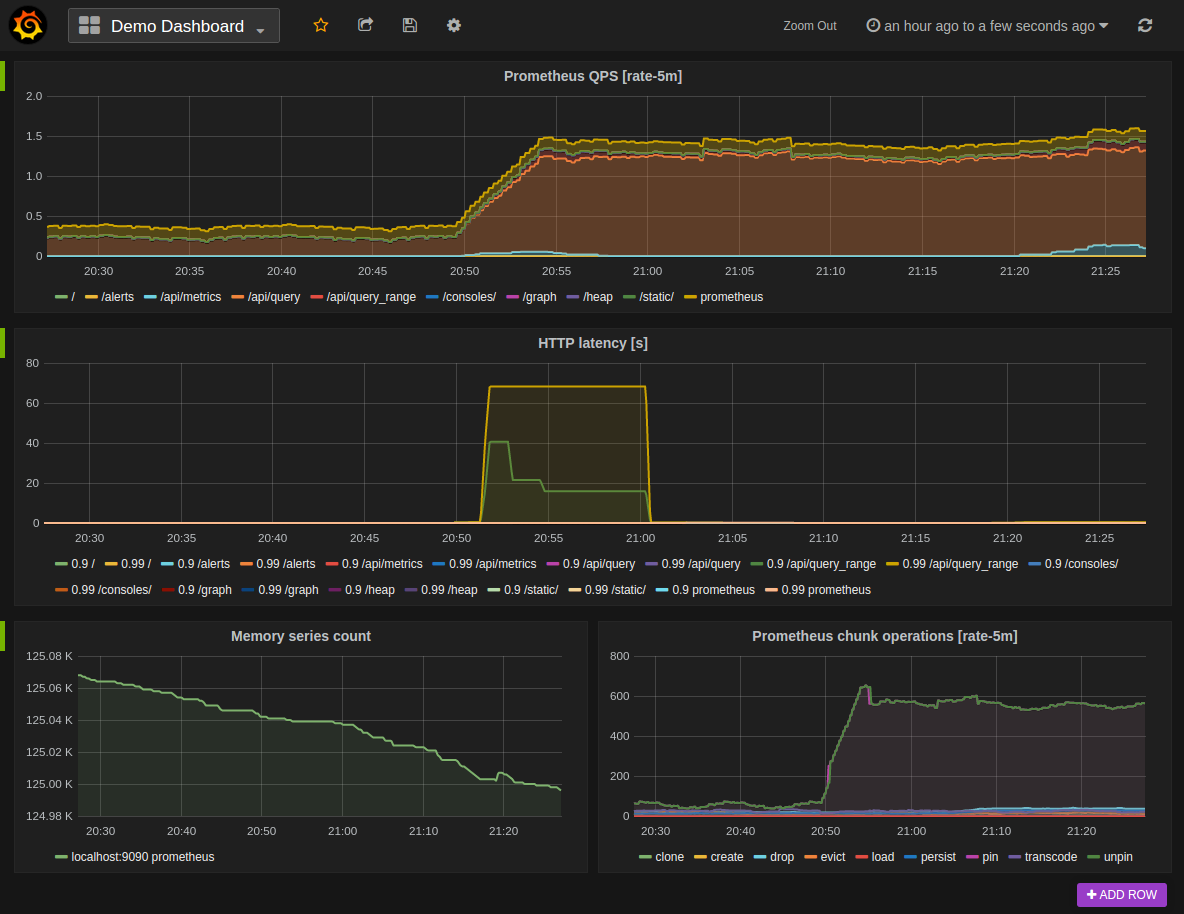
The following shows an example Grafana dashboard which queries Prometheus for data:
Installing
To install Grafana see the official Grafana documentation .
Using
By default, Grafana will be listening on http://localhost:3000 . The default login is "admin" / "admin".
Creating a Prometheus data source
To create a Prometheus data source in Grafana:
- Click on the "cogwheel" in the sidebar to open the Configuration menu.
- Click on "Data Sources".
- Click on "Add data source".
- Select "Prometheus" as the type.
- Set the appropriate Prometheus server URL (for example,
http://localhost:9090/) - Adjust other data source settings as desired (for example, choosing the right Access method).
- Click "Save & Test" to save the new data source.
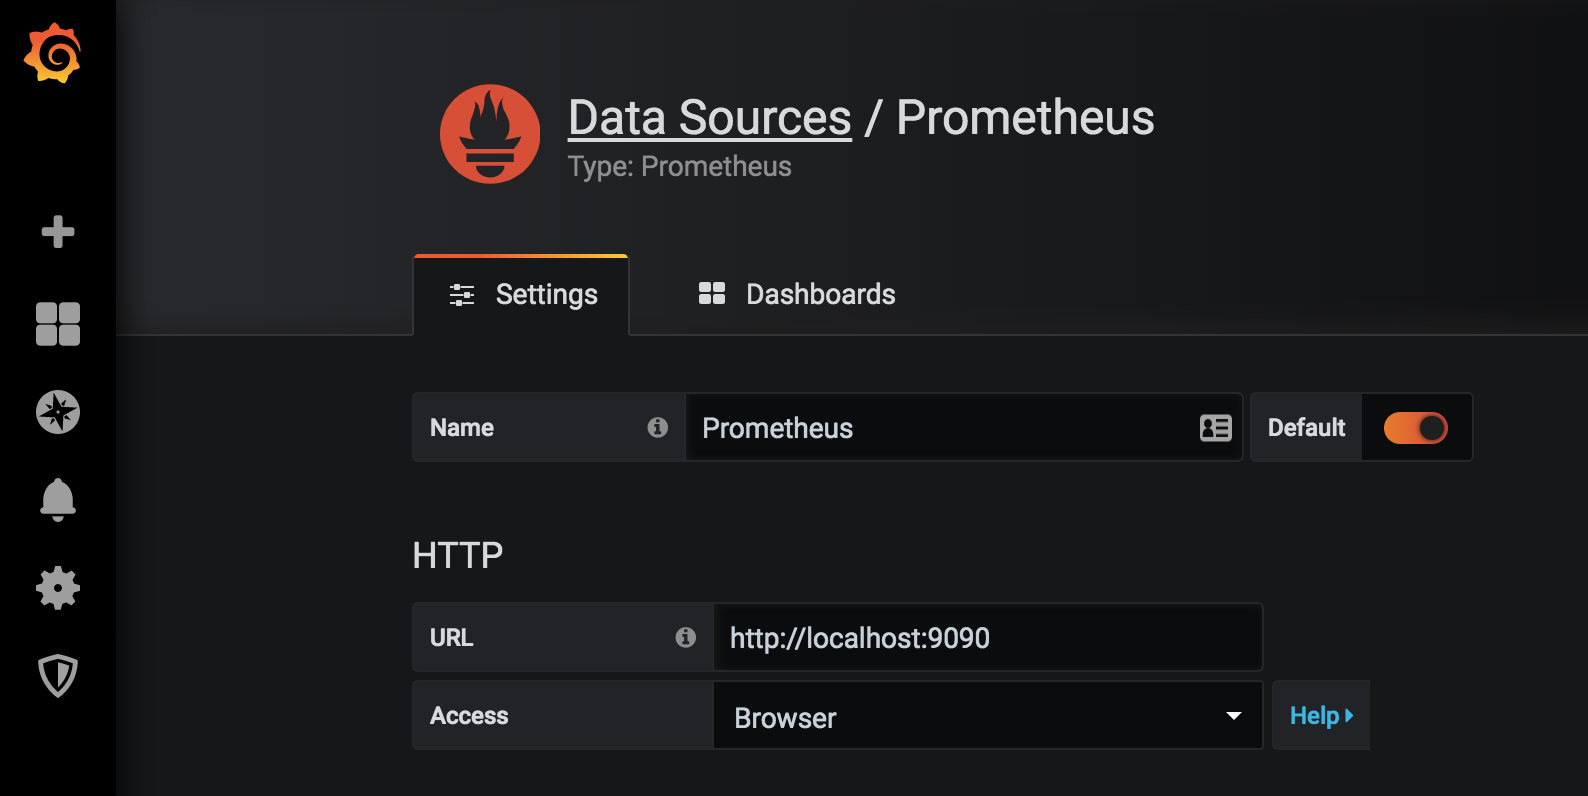
The following shows an example data source configuration:
Creating a Prometheus graph
Follow the standard way of adding a new Grafana graph. Then:
- Click the graph title, then click "Edit".
- Under the "Metrics" tab, select your Prometheus data source (bottom right).
- Enter any Prometheus expression into the "Query" field, while using the "Metric" field to lookup metrics via autocompletion.
- To format the legend names of time series, use the "Legend format" input. For
example, to show only the
methodandstatuslabels of a returned query result, separated by a dash, you could use the legend format string{{method}} - {{status}}. - Tune other graph settings until you have a working graph.
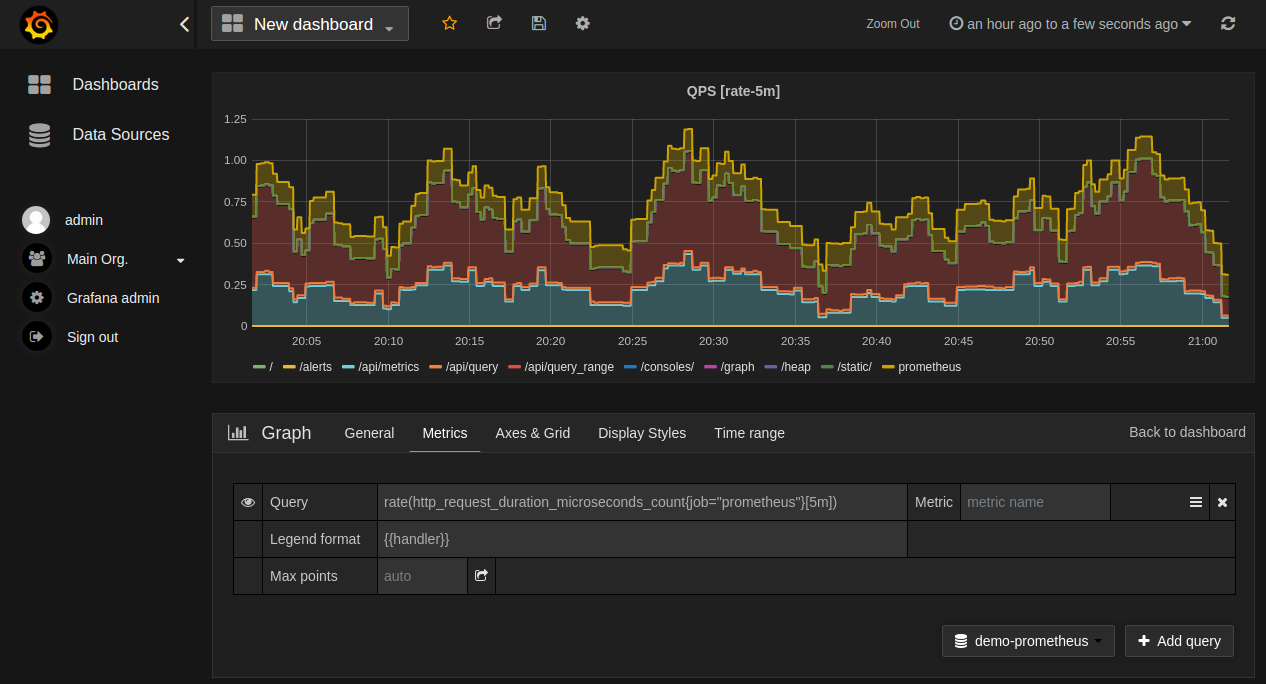
The following shows an example Prometheus graph configuration:
In Grafana 7.2 and later, the $__rate_interval variable is
recommended
for use in the rateand increase functions.
Importing pre-built dashboards from Grafana.com
Grafana.com maintains a collection of shared dashboards which can be downloaded and used with standalone instances of Grafana. Use the Grafana.com "Filter" option to browse dashboards for the "Prometheus" data source only.
You must currently manually edit the downloaded JSON files and correct the
datasource: entries to reflect the Grafana data source name which you
chose for your Prometheus server. Use the "Dashboards" → "Home" → "Import"
option to import the edited dashboard file into your Grafana install.