Our commitment to OpenTelemetry

The OpenTelemetry project is an Observability framework and toolkit designed to create and manage telemetry data such as traces, metrics, and logs. It is gaining widespread adoption due to its consistent specification between signals and promise to reduce vendor lock-in which is something that we’re excited about.

Looking back at 2023

Over the past few years, we have collaborated with the OpenTelemetry community to make sure that OpenTelemetry and Prometheus support each other bidirectionally. This led to the drafting of the official specification to convert between the two systems, as well as the implementations that allow you to ingest Prometheus metrics into OpenTelemetry Collector and vice-versa.

Since then, we have spent a significant amount of time understanding the challenges faced by OpenTelemetry users when storing their metrics in Prometheus and based on those, explored how we can address them. Some of the changes proposed need careful considerations to avoid breaking either side's operating promises, e.g. supporting both push and pull. At PromCon Berlin 2023, we attempted to summarize our ideas in one of the talks.

At our dev summit in Berlin, we spent the majority of our time discussing these changes and our general stance on OpenTelemetry in depth, and the broad consensus is that we want “to be the default store for OpenTelemetry metrics”!

We’ve formed a core group of developers to lead this initiative, and we are going to release a Prometheus 3.0 in 2024 with OTel support as one of its more important features. Here’s a sneak peek at what's coming in 2024.

The year ahead

OTLP Ingestion GA

In Prometheus v2.47.0, released on 6th September 2023, we added experimental support for OTLP ingestion in Prometheus. We’re constantly improving this and we plan to add support for staleness and make it a stable feature. We will also mark our support for out-of-order ingestion as stable. This involves also GA-ing our support for native / exponential histograms.

Support UTF-8 metric and label names

OpenTelemetry semantic conventions push for “.” to be the namespacing character. For example, http.server.request.duration. However, Prometheus currently requires a more limited character set, which means we convert the metric to http_server_request_duration when ingesting it into Prometheus.

This causes unnecessary dissonance and we’re working on removing this limitation by adding UTF-8 support for all labels and metric names. The progress is tracked here.

Native support for resource attributes

OpenTelemetry differentiates between metric attributes (labels to identify the metric itself, like http.status_code) and resource attributes (labels to identify the source of the metrics, like k8s.pod.name), while Prometheus has a more flat label schema. This leads to many usability issues that are detailed here.

We’re exploring several solutions to this problem from many fronts (Query, UX, storage, etc.), but our goal is to make it quite easy to filter and group on resource attributes. This is a work in progress, and feedback and help are wanted!

OTLP export in the ecosystem

Prometheus remote write is supported by most of the leading Observability projects and vendors already. However, OpenTelemetry Protocol (OTLP) is gaining prominence and we would like to support it across the Prometheus ecosystem.

We would like to add support for it to the Prometheus server, SDKs and the exporters. This would mean that any service instrumented with the Prometheus SDKs will also be able to push OTLP and it will unlock the rich Prometheus exporter ecosystem for OpenTelemetry users.

However, we intend to keep and develop the OpenMetrics exposition format as an optimized / simplified format for Prometheus and pull-based use-cases.

Delta temporality

The OpenTelemetry project also supports Delta temporality which has some use-cases for the Observability ecosystem. We have a lot of Prometheus users still running statsd and using the statsd_exporter for various reasons.

We would like to support the Delta temporality of OpenTelemetry in the Prometheus server and are working towards it.

Call for contributions!

As you can see, a lot of new and exciting things are coming to Prometheus! If working in the intersection between two of the most relevant open-source projects around observability sounds challenging and interesting to you, we'd like to have you on board!

This year there is also a change of governance in the works that will make the process of becoming a maintainer easier than ever! If you ever wanted to have an impact on Prometheus, now is a great time to get started.

Our first focus has always been to be as open and transparent as possible on how we are organizing all the work above so that you can also contribute. We are looking for contributors to support this initiative and help implement these features. Check out the Prometheus 3.0 public board and Prometheus OTel support milestone to track the progress of the feature development and see ways that you can contribute.

Conclusion

Some of the changes proposed are large and invasive or involve a fundamental departure from the original data model of Prometheus. However, we plan to introduce these gracefully so that Prometheus 3.0 will have no major breaking changes and most of the users can upgrade without impact.

We are excited to embark on this new chapter for Prometheus and would love your feedback on the changes suggested.

The Schedule for the PromCon Europe 2023 is Live

PromCon Europe is the eighth conference fully dedicated to the Prometheus monitoring system

Berlin, Germany – September 1, 2023 – The CNCF and the Prometheus team, released the two-day schedule for the single-track PromCon Europe 2023 conference happening in Berlin, Germany from September 28 to September 29, 2023. Attendees will be able to choose from 21 full-length (25min) sessions and up to 20 five-minute lightning talk sessions spanning diverse topics related to Prometheus.

Now in its 8th installment, PromCon brings together Prometheus users and developers from around the world to exchange knowledge, best practices, and experience gained through using Prometheus. The program committee reviewed 66 submissions that will provide a fresh and informative look into the most pressing topics around Prometheus today.

"We are super excited for PromCon to be coming home to Berlin. Prometheus was started in Berlin at Soundcloud in 2012. The first PromCon was hosted in Berlin and in between moved to Munich. This year we're hosting around 300 attendees at Radialsystem in Friedrichshain, Berlin. Berlin has a vibrant Prometheus community and many of the Prometheus team members live in the neighborhood. It is a great opportunity to network and connect with the Prometheus family who are all passionate about systems and service monitoring," said Matthias Loibl, Senior Software Engineer at Polar Signals and Prometheus team member who leads this year's PromCon program committee. "It will be a great event to learn about the latest developments from the Prometheus team itself and connect to some big-scale users of Prometheus up close."

The community-curated schedule will feature sessions from open source community members, including:

For the full PromCon Europe 2023 program, please visit the schedule.

Registration

Register for the in-person standard pricing of $350 USD through September 25. The venue has space for 300 attendees so don’t wait!

Thank You to Our Sponsors

PromCon Europe 2023 has been made possible thanks to the amazing community around Prometheus and support from our Diamond Sponsor Grafana Labs, Platinum Sponsor Red Hat as well as many more Gold, and Startup sponsors. This year’s edition is organized by Polar Signals and CNCF.

Watch the Prometheus Documentary

Contact

Jessie Adams-Shore - The Linux Foundation - [email protected]

PromCon Organizers - [email protected]

FAQ about Prometheus 2.43 String Labels Optimization

Prometheus 2.43 has just been released, and it brings some exciting features and enhancements. One of the significant improvements is the stringlabels release, which uses a new data structure for labels. This blog post will answer some frequently asked questions about the 2.43 release and the stringlabels optimizations.

What is the stringlabels release?

The stringlabels release is a Prometheus 2.43 version that uses a new data structure for labels. It stores all the label/values in a single string, resulting in a smaller heap size and some speedups in most cases. These optimizations are not shipped in the default binaries and require compiling Prometheus using the Go tag stringlabels.

Why didn't you go for a feature flag that we can toggle?

We considered using a feature flag but it would have a memory overhead that was not worth it. Therefore, we decided to provide a separate release with these optimizations for those who are interested in testing and measuring the gains on their production environment.

When will these optimizations be generally available?

These optimizations will be available in the upcoming Prometheus 2.44 release by default.

How do I get the 2.43 release?

The Prometheus 2.43 release is available on the official Prometheus GitHub releases page, and users can download the binary files directly from there. Additionally, Docker images are also available for those who prefer to use containers.

The stringlabels optimization is not included in these default binaries. To use this optimization, users will need to download the 2.43.0+stringlabels release binary or the Docker images tagged v2.43.0-stringlabels specifically.

Why is the release v2.43.0+stringlabels and the Docker tag v2.43.0-stringlabels?

In semantic versioning, the plus sign (+) is used to denote build metadata. Therefore, the Prometheus 2.43 release with the stringlabels optimization is named 2.43.0+stringlabels to signify that it includes the experimental stringlabels feature. However, Docker tags do not allow the use of the plus sign in their names. Hence, the plus sign has been replaced with a dash (-) to make the Docker tag v2.43.0-stringlabels. This allows the Docker tag to pass the semantic versioning checks of downstream projects such as the Prometheus Operator.

What are the other noticeable features in the Prometheus 2.43 release?

Apart from the stringlabels optimizations, the Prometheus 2.43 release brings several new features and enhancements. Some of the significant additions include:

  • We added support for scrape_config_files to include scrape configs from different files. This makes it easier to manage and organize the configuration.
  • The HTTP clients now includes two new config options: no_proxy to exclude URLs from proxied requests and proxy_from_environment to read proxies from env variables. These features make it easier to manage the HTTP client's behavior in different environments.

You can learn more about features and bugfixes in the full changelog.

Introducing Prometheus Agent Mode, an Efficient and Cloud-Native Way for Metric Forwarding

Bartek Płotka has been a Prometheus Maintainer since 2019 and Principal Software Engineer at Red Hat. Co-author of the CNCF Thanos project. CNCF Ambassador and tech lead for the CNCF TAG Observability. In his free time, he writes a book titled "Efficient Go" with O'Reilly. Opinions are my own!

What I personally love in the Prometheus project, and one of the many reasons why I joined the team, was the laser focus on the project's goals. Prometheus was always about pushing boundaries when it comes to providing pragmatic, reliable, cheap, yet invaluable metric-based monitoring. Prometheus' ultra-stable and robust APIs, query language, and integration protocols (e.g. Remote Write and OpenMetrics) allowed the Cloud Native Computing Foundation (CNCF) metrics ecosystem to grow on those strong foundations. Amazing things happened as a result:

  • We can see community exporters for getting metrics about virtually everything e.g. containers, eBPF, Minecraft server statistics and even plants' health when gardening.
  • Most people nowadays expect cloud-native software to have an HTTP/HTTPS /metrics endpoint that Prometheus can scrape. A concept developed in secret within Google and pioneered globally by the Prometheus project.
  • The observability paradigm shifted. We see SREs and developers rely heavily on metrics from day one, which improves software resiliency, debuggability, and data-driven decisions!

In the end, we hardly see Kubernetes clusters without Prometheus running there.

The strong focus of the Prometheus community allowed other open-source projects to grow too to extend the Prometheus deployment model beyond single nodes (e.g. Cortex, Thanos and more). Not mentioning cloud vendors adopting Prometheus' API and data model (e.g. Amazon Managed Prometheus, Google Cloud Managed Prometheus, Grafana Cloud and more). If you are looking for a single reason why the Prometheus project is so successful, it is this: Focusing the monitoring community on what matters.

In this (lengthy) blog post, I would love to introduce a new operational mode of running Prometheus called "Agent". It is built directly into the Prometheus binary. The agent mode disables some of Prometheus' usual features and optimizes the binary for scraping and remote writing to remote locations. Introducing a mode that reduces the number of features enables new usage patters. In this blog post I will explain why it is a game-changer for certain deployments in the CNCF ecosystem. I am super excited about this!

History of the Forwarding Use Case

The core design of Prometheus has been unchanged for the project's entire lifetime. Inspired by Google's Borgmon monitoring system, you can deploy a Prometheus server alongside the applications you want to monitor, tell Prometheus how to reach them, and allow to scrape the current values of their metrics at regular intervals. Such a collection method, which is often referred to as the "pull model", is the core principle that allows Prometheus to be lightweight and reliable. Furthermore, it enables application instrumentation and exporters to be dead simple, as they only need to provide a simple human-readable HTTP endpoint with the current value of all tracked metrics (in OpenMetrics format). All without complex push infrastructure and non-trivial client libraries. Overall, a simplified typical Prometheus monitoring deployment looks as below:

Prometheus high-level view

This works great, and we have seen millions of successful deployments like this over the years that process dozens of millions of active series. Some of them for longer time retention, like two years or so. All allow to query, alert, and record metrics useful for both cluster admins and developers.

However, the cloud-native world is constantly growing and evolving. With the growth of managed Kubernetes solutions and clusters created on-demand within seconds, we are now finally able to treat clusters as "cattle", not as "pets" (in other words, we care less about individual instances of those). In some cases, solutions do not even have the cluster notion anymore, e.g. kcp, Fargate and other platforms.

Yoda

The other interesting use case that emerges is the notion of Edge clusters or networks. With industries like telecommunication, automotive and IoT devices adopting cloud-native technologies, we see more and more much smaller clusters with a restricted amount of resources. This is forcing all data (including observability) to be transferred to remote, bigger counterparts as almost nothing can be stored on those remote nodes.

What does that mean? That means monitoring data has to be somehow aggregated, presented to users and sometimes even stored on the global level. This is often called a Global-View feature.

Naively, we could think about implementing this by either putting Prometheus on that global level and scraping metrics across remote networks or pushing metrics directly from the application to the central location for monitoring purposes. Let me explain why both are generally very bad ideas:

🔥 Scraping across network boundaries can be a challenge if it adds new unknowns in a monitoring pipeline. The local pull model allows Prometheus to know why exactly the metric target has problems and when. Maybe it's down, misconfigured, restarted, too slow to give us metrics (e.g. CPU saturated), not discoverable by service discovery, we don't have credentials to access or just DNS, network, or the whole cluster is down. By putting our scraper outside of the network, we risk losing some of this information by introducing unreliability into scrapes that is unrelated to an individual target. On top of that, we risk losing important visibility completely if the network is temporarily down. Please don't do it. It's not worth it. (:

🔥 Pushing metrics directly from the application to some central location is equally bad. Especially when you monitor a larger fleet, you know literally nothing when you don't see metrics from remote applications. Is the application down? Is my receiver pipeline down? Maybe the application failed to authorize? Maybe it failed to get the IP address of my remote cluster? Maybe it's too slow? Maybe the network is down? Worse, you may not even know that the data from some application targets is missing. And you don't even gain a lot as you need to track the state and status of everything that should be sending data. Such a design needs careful analysis as it can be a recipe for a failure too easily.

NOTE: Serverless functions and short-living containers are often cases where we think about push from application as the rescue. At this point however we talk about events or pieces of metrics we might want to aggregate to longer living time series. This topic is discussed here, feel free to contribute and help us support those cases better!

Prometheus introduced three ways to support the global view case, each with its own pros and cons. Let's briefly go through those. They are shown in orange color in the diagram below:

Prometheus global view

  • Federation was introduced as the first feature for aggregation purposes. It allows a global-level Prometheus server to scrape a subset of metrics from a leaf Prometheus. Such a "federation" scrape reduces some unknowns across networks because metrics exposed by federation endpoints include the original samples' timestamps. Yet, it usually suffers from the inability to federate all metrics and not lose data during longer network partitions (minutes).
  • Prometheus Remote Read allows selecting raw metrics from a remote Prometheus server's database without a direct PromQL query. You can deploy Prometheus or other solutions (e.g. Thanos) on the global level to perform PromQL queries on this data while fetching the required metrics from multiple remote locations. This is really powerful as it allows you to store data "locally" and access it only when needed. Unfortunately, there are cons too. Without features like Query Pushdown we are in extreme cases pulling GBs of compressed metric data to answer a single query. Also, if we have a network partition, we are temporarily blind. Last but not least, certain security guidelines are not allowing ingress traffic, only egress one.
  • Finally, we have Prometheus Remote Write, which seems to be the most popular choice nowadays. Since the agent mode focuses on remote write use cases, let's explain it in more detail.

Remote Write

The Prometheus Remote Write protocol allows us to forward (stream) all or a subset of metrics collected by Prometheus to the remote location. You can configure Prometheus to forward some metrics (if you want, with all metadata and exemplars!) to one or more locations that support the Remote Write API. In fact, Prometheus supports both ingesting and sending Remote Write, so you can deploy Prometheus on a global level to receive that stream and aggregate data cross-cluster.

While the official Prometheus Remote Write API specification is in review stage, the ecosystem adopted the Remote Write protocol as the default metrics export protocol. For example, Cortex, Thanos, OpenTelemetry, and cloud services like Amazon, Google, Grafana, Logz.io, etc., all support ingesting data via Remote Write.

The Prometheus project also offers the official compliance tests for its APIs, e.g. remote-write sender compliance for solutions that offer Remote Write client capabilities. It's an amazing way to quickly tell if you are correctly implementing this protocol.

Streaming data from such a scraper enables Global View use cases by allowing you to store metrics data in a centralized location. This also enables separation of concerns, which is useful when applications are managed by different teams than the observability or monitoring pipelines. Furthermore, it is also why Remote Write is chosen by vendors who want to offload as much work from their customers as possible.

Wait for a second, Bartek. You just mentioned before that pushing metrics directly from the application is not the best idea!

Sure, but the amazing part is that, even with Remote Write, Prometheus still uses a pull model to gather metrics from applications, which gives us an understanding of those different failure modes. After that, we batch samples and series and export, replicate (push) data to the Remote Write endpoints, limiting the number of monitoring unknowns that the central point has!

It's important to note that a reliable and efficient remote-writing implementation is a non-trivial problem to solve. The Prometheus community spent around three years to come up with a stable and scalable implementation. We reimplemented the WAL (write-ahead-log) a few times, added internal queuing, sharding, smart back-offs and more. All of this is hidden from the user, who can enjoy well-performing streaming or large amounts of metrics stored in a centralized location.

Hands-on Remote Write Example: Katacoda Tutorial

All of this is not new in Prometheus. Many of us already use Prometheus to scrape all required metrics and remote-write all or some of them to remote locations.

Suppose you would like to try the hands-on experience of remote writing capabilities. In that case, we recommend the Thanos Katacoda tutorial of remote writing metrics from Prometheus, which explains all steps required for Prometheus to forward all metrics to the remote location. It's free, just sign up for an account and enjoy the tutorial! 🤗

Note that this example uses Thanos in receive mode as the remote storage. Nowadays, you can use plenty of other projects that are compatible with the remote write API.

So if remote writing works fine, why did we add a special Agent mode to Prometheus?

Prometheus Agent Mode

From Prometheus v2.32.0 (next release), everyone will be able to run the Prometheus binary with an experimental --enable-feature=agent flag. If you want to try it before the release, feel free to use Prometheus v2.32.0-beta.0 or use our quay.io/prometheus/prometheus:v2.32.0-beta.0 image.

The Agent mode optimizes Prometheus for the remote write use case. It disables querying, alerting, and local storage, and replaces it with a customized TSDB WAL. Everything else stays the same: scraping logic, service discovery and related configuration. It can be used as a drop-in replacement for Prometheus if you want to just forward your data to a remote Prometheus server or any other Remote-Write-compliant project. In essence it looks like this:

Prometheus agent

The best part about Prometheus Agent is that it's built into Prometheus. Same scraping APIs, same semantics, same configuration and discovery mechanism.

What are the benefits of using the Agent mode if you plan not to query or alert on data locally and stream metrics outside? There are a few:

First of all, efficiency. Our customized Agent TSDB WAL removes the data immediately after successful writes. If it cannot reach the remote endpoint, it persists the data temporarily on the disk until the remote endpoint is back online. This is currently limited to a two-hour buffer only, similar to non-agent Prometheus, hopefully unblocked soon. This means that we don't need to build chunks of data in memory. We don't need to maintain a full index for querying purposes. Essentially the Agent mode uses a fraction of the resources that a normal Prometheus server would use in a similar situation.

Does this efficiency matter? Yes! As we mentioned, every GB of memory and every CPU core used on edge clusters matters for some deployments. On the other hand, the paradigm of performing monitoring using metrics is quite mature these days. This means that the more relevant metrics with more cardinality you can ship for the same cost - the better.

NOTE: With the introduction of the Agent mode, the original Prometheus server mode still stays as the recommended, stable and maintained mode. Agent mode with remote storage brings additional complexity. Use with care.

Secondly, the benefit of the new Agent mode is that it enables easier horizontal scalability for ingestion. This is something I am excited about the most. Let me explain why.

The Dream: Auto-Scalable Metric Ingestion

A true auto-scalable solution for scraping would need to be based on the amount of metric targets and the number of metrics they expose. The more data we have to scrape, the more instances of Prometheus we deploy automatically. If the number of targets or their number of metrics goes down, we could scale down and remove a couple of instances. This would remove the manual burden of adjusting the sizing of Prometheus and stop the need for over-allocating Prometheus for situations where the cluster is temporarily small.

With just Prometheus in server mode, this was hard to achieve. This is because Prometheus in server mode is stateful. Whatever is collected stays as-is in a single place. This means that the scale-down procedure would need to back up the collected data to existing instances before termination. Then we would have the problem of overlapping scrapes, misleading staleness markers etc.

On top of that, we would need some global view query that is able to aggregate all samples across all instances (e.g. Thanos Query or Promxy). Last but not least, the resource usage of Prometheus in server mode depends on more things than just ingestion. There is alerting, recording, querying, compaction, remote write etc., that might need more or fewer resources independent of the number of metric targets.

Agent mode essentially moves the discovery, scraping and remote writing to a separate microservice. This allows a focused operational model on ingestion only. As a result, Prometheus in Agent mode is more or less stateless. Yes, to avoid loss of metrics, we need to deploy an HA pair of agents and attach a persistent disk to them. But technically speaking, if we have thousands of metric targets (e.g. containers), we can deploy multiple Prometheus agents and safely change which replica is scraping which targets. This is because, in the end, all samples will be pushed to the same central storage.

Overall, Prometheus in Agent mode enables easy horizontal auto-scaling capabilities of Prometheus-based scraping that can react to dynamic changes in metric targets. This is definitely something we will look at with the Prometheus Kubernetes Operator community going forward.

Now let's take a look at the currently implemented state of agent mode in Prometheus. Is it ready to use?

Agent Mode Was Proven at Scale

The next release of Prometheus will include Agent mode as an experimental feature. Flags, APIs and WAL format on disk might change. But the performance of the implementation is already battle-tested thanks to Grafana Labs' open-source work.

The initial implementation of our Agent's custom WAL was inspired by the current Prometheus server's TSDB WAL and created by Robert Fratto in 2019, under the mentorship of Tom Wilkie, Prometheus maintainer. It was then used in an open-source Grafana Agent project that was since then used by many Grafana Cloud customers and community members. Given the maturity of the solution, it was time to donate the implementation to Prometheus for native integration and bigger adoption. Robert (Grafana Labs), with the help of Srikrishna (Red Hat) and the community, ported the code to the Prometheus codebase, which was merged to main 2 weeks ago!

The donation process was quite smooth. Since some Prometheus maintainers contributed to this code before within the Grafana Agent, and since the new WAL is inspired by Prometheus' own WAL, it was not hard for the current Prometheus TSDB maintainers to take it under full maintenance! It also really helps that Robert is joining the Prometheus Team as a TSDB maintainer (congratulations!).

Now, let's explain how you can use it! (:

How to Use Agent Mode in Detail

From now on, if you show the help output of Prometheus (--help flag), you should see more or less the following:

usage: prometheus [<flags>]

The Prometheus monitoring server

Flags:
  -h, --help                     Show context-sensitive help (also try --help-long and --help-man).
      (... other flags)
      --storage.tsdb.path="data/"
                                 Base path for metrics storage. Use with server mode only.
      --storage.agent.path="data-agent/"
                                 Base path for metrics storage. Use with agent mode only.
      (... other flags)
      --enable-feature= ...      Comma separated feature names to enable. Valid options: agent, exemplar-storage, expand-external-labels, memory-snapshot-on-shutdown, promql-at-modifier, promql-negative-offset, remote-write-receiver,
                                 extra-scrape-metrics, new-service-discovery-manager. See https://prometheus.io/docs/prometheus/latest/feature_flags/ for more details.

Since the Agent mode is behind a feature flag, as mentioned previously, use the --enable-feature=agent flag to run Prometheus in the Agent mode. Now, the rest of the flags are either for both server and Agent or only for a specific mode. You can see which flag is for which mode by checking the last sentence of a flag's help string. "Use with server mode only" means it's only for server mode. If you don't see any mention like this, it means the flag is shared.

The Agent mode accepts the same scrape configuration with the same discovery options and remote write options.

It also exposes a web UI with disabled query capabitilies, but showing build info, configuration, targets and service discovery information as in a normal Prometheus server.

Hands-on Prometheus Agent Example: Katacoda Tutorial

Similarly to Prometheus remote-write tutorial, if you would like to try the hands-on experience of Prometheus Agent capabilities, we recommend the Thanos Katacoda tutorial of Prometheus Agent, which explains how easy it is to run Prometheus Agent.

Summary

I hope you found this interesting! In this post, we walked through the new cases that emerged like:

  • edge clusters
  • limited access networks
  • large number of clusters
  • ephemeral and dynamic clusters

We then explained the new Prometheus Agent mode that allows efficiently forwarding scraped metrics to the remote write endpoints.

As always, if you have any issues or feedback, feel free to submit a ticket on GitHub or ask questions on the mailing list.

This blog post is part of a coordinated release between CNCF, Grafana, and Prometheus. Feel free to also read the CNCF announcement and the angle on the Grafana Agent which underlies the Prometheus Agent.

Prometheus Conformance Program: First round of results

Today, we're launching the Prometheus Conformance Program with the goal of ensuring interoperability between different projects and vendors in the Prometheus monitoring space. While the legal paperwork still needs to be finalized, we ran tests, and we consider the below our first round of results. As part of this launch Julius Volz updated his PromQL test results.

As a quick reminder: The program is called Prometheus Conformance, software can be compliant to specific tests, which result in a compatibility rating. The nomenclature might seem complex, but it allows us to speak about this topic without using endless word snakes.

Preamble

New Categories

We found that it's quite hard to reason about what needs to be applied to what software. To help sort my thoughts, we created an overview, introducing four new categories we can put software into:

  • Metrics Exposers
  • Agents/Collectors
  • Prometheus Storage Backends
  • Full Prometheus Compatibility

Call for Action

Feedback is very much welcome. Maybe counter-intuitively, we want the community, not just Prometheus-team, to shape this effort. To help with that, we will launch a WG Conformance within Prometheus. As with WG Docs and WG Storage, those will be public and we actively invite participation.

As we alluded to recently, the maintainer/adoption ratio of Prometheus is surprisingly, or shockingly, low. In different words, we hope that the economic incentives around Prometheus Compatibility will entice vendors to assign resources in building out the tests with us. If you always wanted to contribute to Prometheus during work time, this might be the way; and a way that will have you touch a lot of highly relevant aspects of Prometheus. There's a variety of ways to get in touch with us.

Register for being tested

You can use the same communication channels to get in touch with us if you want to register for being tested. Once the paperwork is in place, we will hand contact information and contract operations over to CNCF.

Test results

Full Prometheus Compatibility

We know what tests we want to build out, but we are not there yet. As announced previously, it would be unfair to hold this against projects or vendors. As such, test shims are defined as being passed. The currently semi-manual nature of e.g. the PromQL tests Julius ran this week mean that Julius tested sending data through Prometheus Remote Write in most cases as part of PromQL testing. We're reusing his results in more than one way here. This will be untangled soon, and more tests from different angles will keep ratcheting up the requirements and thus End User confidence.

It makes sense to look at projects and aaS offerings in two sets.

Projects

Passing

  • Cortex 1.10.0
  • M3 1.3.0
  • Promscale 0.6.2
  • Thanos 0.23.1

Not passing

VictoriaMetrics 1.67.0 is not passing and does not intend to pass. In the spirit of End User confidence, we decided to track their results while they position themselves as a drop-in replacement for Prometheus.

aaS

Passing

  • Chronosphere
  • Grafana Cloud

Not passing

  • Amazon Managed Service for Prometheus
  • Google Cloud Managed Service for Prometheus
  • New Relic
  • Sysdig Monitor

NB: As Amazon Managed Service for Prometheus is based on Cortex just like Grafana Cloud, we expect them to pass after the next update cycle.

Agent/Collector

Passing

  • Grafana Agent 0.19.0
  • OpenTelemetry Collector 0.37.0
  • Prometheus 2.30.3

Not passing

  • Telegraf 1.20.2
  • Timber Vector 0.16.1
  • VictoriaMetrics Agent 1.67.0

NB: We tested Vector 0.16.1 instead of 0.17.0 because there are no binary downloads for 0.17.0 and our test toolchain currently expects binaries.

On Ransomware Naming

As per Oscar Wilde, imitation is the sincerest form of flattery.

The names "Prometheus" and "Thanos" have recently been taken up by a ransomware group. There's not much we can do about that except to inform you that this is happening. There's not much you can do either, except be aware that this is happening.

While we do NOT have reason to believe that this group will try to trick anyone into downloading fake binaries of our projects, we still recommend following common supply chain & security practices. When deploying software, do it through one of those mechanisms:

Unless you can reasonably trust the specific providence and supply chain, you should not use software.

As there's a non-zero chance that the ransomware group chose the names deliberately and thus might come across this blog post: Please stop. With both the ransomware and the naming choice.

Prometheus Conformance Program: Remote Write Compliance Test Results

As announced by CNCF and by ourselves, we're starting a Prometheus conformance program.

To give everyone an overview of where the ecosystem is before running tests officially, we wanted to show off the newest addition to our happy little bunch of test suites: The Prometheus Remote Write compliance test suite tests the sender part of the Remote Write protocol against our specification.

During Monday's PromCon, Tom Wilkie presented the test results from the time of recording a few weeks ago. In the live section, he already had an update. Two days later we have two more updates: The addition of the observability pipeline tool Vector, as well as new versions of existing systems.

So, without further ado, the current results in alphabetical order are:

Sender Version Score
Grafana Agent 0.13.1 100%
Prometheus 2.26.0 100%
OpenTelemetry Collector 0.26.0 41%
Telegraf 1.18.2 65%
Timber Vector 0.13.1 35%
VictoriaMetrics Agent 1.59.0 76%

The raw results are:

--- PASS: TestRemoteWrite/grafana (0.01s)
    --- PASS: TestRemoteWrite/grafana/Counter (10.02s)
    --- PASS: TestRemoteWrite/grafana/EmptyLabels (10.02s)
    --- PASS: TestRemoteWrite/grafana/Gauge (10.02s)
    --- PASS: TestRemoteWrite/grafana/Headers (10.02s)
    --- PASS: TestRemoteWrite/grafana/Histogram (10.02s)
    --- PASS: TestRemoteWrite/grafana/HonorLabels (10.02s)
    --- PASS: TestRemoteWrite/grafana/InstanceLabel (10.02s)
    --- PASS: TestRemoteWrite/grafana/Invalid (10.02s)
    --- PASS: TestRemoteWrite/grafana/JobLabel (10.02s)
    --- PASS: TestRemoteWrite/grafana/NameLabel (10.02s)
    --- PASS: TestRemoteWrite/grafana/Ordering (26.12s)
    --- PASS: TestRemoteWrite/grafana/RepeatedLabels (10.02s)
    --- PASS: TestRemoteWrite/grafana/SortedLabels (10.02s)
    --- PASS: TestRemoteWrite/grafana/Staleness (10.01s)
    --- PASS: TestRemoteWrite/grafana/Summary (10.01s)
    --- PASS: TestRemoteWrite/grafana/Timestamp (10.01s)
    --- PASS: TestRemoteWrite/grafana/Up (10.02s)
--- PASS: TestRemoteWrite/prometheus (0.01s)
    --- PASS: TestRemoteWrite/prometheus/Counter (10.02s)
    --- PASS: TestRemoteWrite/prometheus/EmptyLabels (10.02s)
    --- PASS: TestRemoteWrite/prometheus/Gauge (10.02s)
    --- PASS: TestRemoteWrite/prometheus/Headers (10.02s)
    --- PASS: TestRemoteWrite/prometheus/Histogram (10.02s)
    --- PASS: TestRemoteWrite/prometheus/HonorLabels (10.02s)
    --- PASS: TestRemoteWrite/prometheus/InstanceLabel (10.02s)
    --- PASS: TestRemoteWrite/prometheus/Invalid (10.02s)
    --- PASS: TestRemoteWrite/prometheus/JobLabel (10.02s)
    --- PASS: TestRemoteWrite/prometheus/NameLabel (10.03s)
    --- PASS: TestRemoteWrite/prometheus/Ordering (24.99s)
    --- PASS: TestRemoteWrite/prometheus/RepeatedLabels (10.02s)
    --- PASS: TestRemoteWrite/prometheus/SortedLabels (10.02s)
    --- PASS: TestRemoteWrite/prometheus/Staleness (10.02s)
    --- PASS: TestRemoteWrite/prometheus/Summary (10.02s)
    --- PASS: TestRemoteWrite/prometheus/Timestamp (10.02s)
    --- PASS: TestRemoteWrite/prometheus/Up (10.02s)
--- FAIL: TestRemoteWrite/otelcollector (0.00s)
    --- FAIL: TestRemoteWrite/otelcollector/Counter (10.01s)
    --- FAIL: TestRemoteWrite/otelcollector/Histogram (10.01s)
    --- FAIL: TestRemoteWrite/otelcollector/InstanceLabel (10.01s)
    --- FAIL: TestRemoteWrite/otelcollector/Invalid (10.01s)
    --- FAIL: TestRemoteWrite/otelcollector/JobLabel (10.01s)
    --- FAIL: TestRemoteWrite/otelcollector/Ordering (13.54s)
    --- FAIL: TestRemoteWrite/otelcollector/RepeatedLabels (10.01s)
    --- FAIL: TestRemoteWrite/otelcollector/Staleness (10.01s)
    --- FAIL: TestRemoteWrite/otelcollector/Summary (10.01s)
    --- FAIL: TestRemoteWrite/otelcollector/Up (10.01s)
    --- PASS: TestRemoteWrite/otelcollector/EmptyLabels (10.01s)
    --- PASS: TestRemoteWrite/otelcollector/Gauge (10.01s)
    --- PASS: TestRemoteWrite/otelcollector/Headers (10.01s)
    --- PASS: TestRemoteWrite/otelcollector/HonorLabels (10.01s)
    --- PASS: TestRemoteWrite/otelcollector/NameLabel (10.01s)
    --- PASS: TestRemoteWrite/otelcollector/SortedLabels (10.01s)
    --- PASS: TestRemoteWrite/otelcollector/Timestamp (10.01s)
--- FAIL: TestRemoteWrite/telegraf (0.01s)
    --- FAIL: TestRemoteWrite/telegraf/EmptyLabels (14.60s)
    --- FAIL: TestRemoteWrite/telegraf/HonorLabels (14.61s)
    --- FAIL: TestRemoteWrite/telegraf/Invalid (14.61s)
    --- FAIL: TestRemoteWrite/telegraf/RepeatedLabels (14.61s)
    --- FAIL: TestRemoteWrite/telegraf/Staleness (14.59s)
    --- FAIL: TestRemoteWrite/telegraf/Up (14.60s)
    --- PASS: TestRemoteWrite/telegraf/Counter (14.61s)
    --- PASS: TestRemoteWrite/telegraf/Gauge (14.60s)
    --- PASS: TestRemoteWrite/telegraf/Headers (14.61s)
    --- PASS: TestRemoteWrite/telegraf/Histogram (14.61s)
    --- PASS: TestRemoteWrite/telegraf/InstanceLabel (14.61s)
    --- PASS: TestRemoteWrite/telegraf/JobLabel (14.61s)
    --- PASS: TestRemoteWrite/telegraf/NameLabel (14.60s)
    --- PASS: TestRemoteWrite/telegraf/Ordering (14.61s)
    --- PASS: TestRemoteWrite/telegraf/SortedLabels (14.61s)
    --- PASS: TestRemoteWrite/telegraf/Summary (14.60s)
    --- PASS: TestRemoteWrite/telegraf/Timestamp (14.61s)
--- FAIL: TestRemoteWrite/vector (0.01s)
    --- FAIL: TestRemoteWrite/vector/Counter (10.02s)
    --- FAIL: TestRemoteWrite/vector/EmptyLabels (10.01s)
    --- FAIL: TestRemoteWrite/vector/Headers (10.02s)
    --- FAIL: TestRemoteWrite/vector/HonorLabels (10.02s)
    --- FAIL: TestRemoteWrite/vector/InstanceLabel (10.02s)
    --- FAIL: TestRemoteWrite/vector/Invalid (10.02s)
    --- FAIL: TestRemoteWrite/vector/JobLabel (10.01s)
    --- FAIL: TestRemoteWrite/vector/Ordering (13.01s)
    --- FAIL: TestRemoteWrite/vector/RepeatedLabels (10.02s)
    --- FAIL: TestRemoteWrite/vector/Staleness (10.02s)
    --- FAIL: TestRemoteWrite/vector/Up (10.02s)
    --- PASS: TestRemoteWrite/vector/Gauge (10.02s)
    --- PASS: TestRemoteWrite/vector/Histogram (10.02s)
    --- PASS: TestRemoteWrite/vector/NameLabel (10.02s)
    --- PASS: TestRemoteWrite/vector/SortedLabels (10.02s)
    --- PASS: TestRemoteWrite/vector/Summary (10.02s)
    --- PASS: TestRemoteWrite/vector/Timestamp (10.02s)
--- FAIL: TestRemoteWrite/vmagent (0.01s)
    --- FAIL: TestRemoteWrite/vmagent/Invalid (20.66s)
    --- FAIL: TestRemoteWrite/vmagent/Ordering (22.05s)
    --- FAIL: TestRemoteWrite/vmagent/RepeatedLabels (20.67s)
    --- FAIL: TestRemoteWrite/vmagent/Staleness (20.67s)
    --- PASS: TestRemoteWrite/vmagent/Counter (20.67s)
    --- PASS: TestRemoteWrite/vmagent/EmptyLabels (20.64s)
    --- PASS: TestRemoteWrite/vmagent/Gauge (20.66s)
    --- PASS: TestRemoteWrite/vmagent/Headers (20.64s)
    --- PASS: TestRemoteWrite/vmagent/Histogram (20.66s)
    --- PASS: TestRemoteWrite/vmagent/HonorLabels (20.66s)
    --- PASS: TestRemoteWrite/vmagent/InstanceLabel (20.66s)
    --- PASS: TestRemoteWrite/vmagent/JobLabel (20.66s)
    --- PASS: TestRemoteWrite/vmagent/NameLabel (20.66s)
    --- PASS: TestRemoteWrite/vmagent/SortedLabels (20.66s)
    --- PASS: TestRemoteWrite/vmagent/Summary (20.66s)
    --- PASS: TestRemoteWrite/vmagent/Timestamp (20.67s)
    --- PASS: TestRemoteWrite/vmagent/Up (20.66s)

We'll work more on improving our test suites, both by adding more tests & by adding new test targets. If you want to help us, consider adding more of our list of Remote Write integrations.

Introducing the Prometheus Conformance Program

Prometheus is the standard for metric monitoring in the cloud native space and beyond. To ensure interoperability, to protect users from suprises, and to enable more parallel innovation, the Prometheus project is introducing the Prometheus Conformance Program with the help of CNCF to certify component compliance and Prometheus compatibility.

The CNCF Governing Board is expected to formally review and approve the program during their next meeting. We invite the wider community to help improve our tests in this ramp-up phase.

With the help of our extensive and expanding test suite, projects and vendors can determine the compliance to our specifications and compatibility within the Prometheus ecosystem.

At launch, we are offering compliance tests for three components:

  • PromQL (needs manual interpretation, somewhat complete)
  • Remote Read-Write (fully automated, WIP)
  • OpenMetrics (partially automatic, somewhat complete, will need questionnaire)

We plan to add more components. Tests for Prometheus Remote Read or our data storage/TSDB are likely as next additions. We explicitly invite everyone to extend and improve existing tests, and to submit new ones.

The Prometheus Conformance Program works as follows:

For every component, there will be a mark "foo YYYY-MM compliant", e.g. "OpenMetrics 2021-05 compliant", "PromQL 2021-05 compliant", and "Prometheus Remote Write 2021-05 compliant". Any project or vendor can submit their compliance documentation. Upon reaching 100%, the mark will be granted.

For any complete software, there will be a mark "Prometheus x.y compatible", e.g. "Prometheus 2.26 compatible". Relevant component compliance scores are multiplied. Upon reaching 100%, the mark will be granted.

As an example, the Prometheus Agent supports both OpenMetrics and Prometheus Remote Write, but not PromQL. As such, only compliance scores for OpenMetrics and Prometheus Remote Write are multiplied.

Both compliant and compatible marks are valid for 2 minor releases or 12 weeks, whichever is longer.

Introducing the '@' Modifier

Have you ever selected the top 10 time series for something, but instead of 10 you got 100? If yes, this one is for you. Let me walk you through what the underlying problem is and how I fixed it.

Currently, the topk() query only makes sense as an instant query where you get exactly k results, but when you run it as a range query, you can get much more than k results since every step is evaluated independently. This @ modifier lets you fix the ranking for all the steps in a range query.

In Prometheus v2.25.0, we have introduced a new PromQL modifier @. Similar to how offset modifier lets you offset the evaluation of vector selector, range vector selector, and subqueries by a fixed duration relative to the evaluation time, the @ modifier lets you fix the evaluation for those selectors irrespective of the query evaluation time. The credits for this syntax goes to Björn Rabenstein.

<vector-selector> @ <timestamp>
<range-vector-selector> @ <timestamp>
<subquery> @ <timestamp>

The <timestamp> is a unix timestamp and described with a float literal.

For example, the query http_requests_total @ 1609746000 returns the value of http_requests_total at 2021-01-04T07:40:00+00:00. The query rate(http_requests_total[5m] @ 1609746000) returns the 5-minute rate of http_requests_total at the same time.

Additionally, start() and end() can also be used as values for the @ modifier as special values. For a range query, they resolve to the start and end of the range query respectively and remain the same for all steps. For an instant query, start() and end() both resolve to the evaluation time.

Coming back to the topk() fix, the following query plots the 1m rate of http_requests_total of those series whose last 1h rate was among the top 5. Hence now you can make sense of the topk() even as a range query where it plots exactly k results.

rate(http_requests_total[1m]) # This acts like the actual selector.
  and
topk(5, rate(http_requests_total[1h] @ end())) # This acts like a ranking function which filters the selector.

Similarly, the topk() ranking can be replaced with other functions like histogram_quantile() which only makes sense as an instant query right now. rate() can be replaced with <aggregation>_over_time(), etc. Let us know how you use this new modifier!

@ modifier is disabled by default and can be enabled using the flag --enable-feature=promql-at-modifier. Learn more about feature flags in this blog post and find the docs for @ modifier here.

Introducing Feature Flags

We have always made hard promises around stability and breaking changes following the SemVer model. That will remain to be the case.

As we want to be bolder in experimentation, we are planning to use feature flags more.

Starting with v2.25.0, we have introduced a new section called disabled features which have the features hidden behind the --enable-feature flag. You can expect more and more features getting added to this section in the future releases.

The features in this list are considered experimental and comes with following considerations as long as they are still behind --enable-feature:

  1. API specs may change if the feature has any API (web API, code interfaces, etc.).
  2. The behavior of the feature may change.
  3. They may break some assumption that you might have had about Prometheus.
    • For example the assumption that a query does not look ahead of the evaluation time for samples, which will be broken by @ modifier and negative offset.
  4. They may be unstable but we will try to keep them stable, of course.

These considerations allow us to be more bold with experimentation and to innovate more quickly. Once any feature gets widely used and is considered stable with respect to its API, behavior, and implementation, they may be moved from disabled features list and enabled by default . If we find any feature to be not worth it or broken, we may completely remove it. If enabling some feature is considered a big breaking change for Prometheus, it would stay disabled until the next major release.

Keep an eye out on this list on every release, and do try them out!

Remote Read Meets Streaming

The new Prometheus version 2.13.0 is available and as always, it includes many fixes and improvements. You can read what's changed here. However, there is one feature that some projects and users were waiting for: chunked, streamed version of remote read API.

In this article I would like to present a deep dive of what we changed in the remote protocol, why it was changed and how to use it effectively.

Remote APIs

Since version 1.x, Prometheus has the ability to interact directly with its storage using the remote API.

This API allows 3rd party systems to interact with metrics data through two methods:

  • Write - receive samples pushed by Prometheus
  • Read - pull samples from Prometheus

Remote read and write architecture

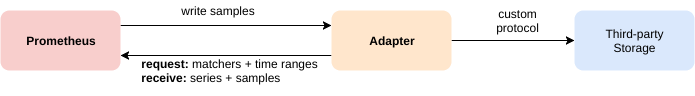
Both methods are using HTTP with messages encoded with protobufs. The request and response for both methods are compressed using snappy.

Remote Write

This is the most popular way to replicate Prometheus data into 3rd party system. In this mode, Prometheus streams samples, by periodically sending a batch of samples to the given endpoint.

Remote write was recently improved massively in March with WAL-based remote write which improved the reliability and resource consumption. It is also worth to note that the remote write is supported by almost all 3rd party integrations mentioned here.

Remote Read

The read method is less common. It was added in March 2017 (server side) and has not seen significant development since then.

The release of Prometheus 2.13.0 includes a fix for known resource bottlenecks in the Read API. This article will focus on these improvements.

The key idea of the remote read is to allow querying Prometheus storage (TSDB) directly without PromQL evaluation. It is similar to the Querier interface that the PromQL engine uses to retrieve data from storage.

This essentially allows read access of time series in TSDB that Prometheus collected. The main use cases for remote read are:

  • Seamless Prometheus upgrades between different data formats of Prometheus, so having Prometheus reading from another Prometheus.
  • Prometheus being able to read from 3rd party long term storage systems e.g InfluxDB.
  • 3rd party system querying data from Prometheus e.g Thanos.

The remote read API exposes a simple HTTP endpoint that expects following protobuf payload:

message ReadRequest {
  repeated Query queries = 1;
}

message Query {
  int64 start_timestamp_ms = 1;
  int64 end_timestamp_ms = 2;
  repeated prometheus.LabelMatcher matchers = 3;
  prometheus.ReadHints hints = 4;
}

With this payload, the client can request certain series matching given matchers and time range with end and start.

The response is equally simple:

message ReadResponse {
  // In same order as the request's queries.
  repeated QueryResult results = 1;
}

message Sample {
  double value    = 1;
  int64 timestamp = 2;
}

message TimeSeries {
  repeated Label labels   = 1;
  repeated Sample samples = 2;
}

message QueryResult {
  repeated prometheus.TimeSeries timeseries = 1;
}

Remote read returns the matched time series with raw samples of value and timestamp.

Problem Statement

There were two key problems for such a simple remote read. It was easy to use and understand, but there were no streaming capabilities within single HTTP request for the protobuf format we defined. Secondly, the response was including raw samples (float64 value and int64 timestamp) instead of an encoded, compressed batch of samples called "chunks" that are used to store metrics inside TSDB.

The server algorithm for remote read without streaming was:

  1. Parse request.
  2. Select metrics from TSDB.
  3. For all decoded series:
    • For all samples:
      • Add to response protobuf
  4. Marshal response.
  5. Snappy compress.
  6. Send back the HTTP response.

The whole response of the remote read had to be buffered in a raw, uncompressed format in order to marshsal it in a potentially huge protobuf message before sending it to the client. The whole response has to then be fully buffered in the client again to be able to unmarshal it from the received protobuf. Only after that the client was able to use raw samples.

What does it mean? It means that requests for, let's say, only 8 hours that matches 10,000 series can take up to 2.5GB of memory allocated by both client and server each!

Below is memory usage metric for both Prometheus and Thanos Sidecar (remote read client) during remote read request time:

Prometheus 2.12.0: RSS of single read 8h of 10k series

Prometheus 2.12.0: Heap-only allocations of single read 8h of 10k series

It is worth to noting that querying 10,000 series is not a great idea, even for Prometheus native HTTP query_range endpoint, as your browser simply will not be happy fetching, storing and rendering hundreds of megabytes of data. Additionally, for dashboards and rendering purposes it is not practical to have that much data, as humans can't possibly read it. That is why usually we craft queries that have no more than 20 series.

This is great, but a very common technique is to compose queries in such way that query returns aggregated 20 series, however underneath the query engine has to touch potentially thousands of series to evaluate the response (e.g when using aggregators). That is why systems like Thanos, which among other data, uses TSDB data from remote read, it's very often the case that the request is heavy.

Solution

To explain the solution to this problem, it is helpful to understand how Prometheus iterates over the data when queried. The core concept can be shown in Querier's Select method returned type called SeriesSet. The interface is presented below:

// SeriesSet contains a set of series.
type SeriesSet interface {
    Next() bool
    At() Series
    Err() error
}

// Series represents a single time series.
type Series interface {
    // Labels returns the complete set of labels identifying the series.
    Labels() labels.Labels
    // Iterator returns a new iterator of the data of the series.
    Iterator() SeriesIterator
}

// SeriesIterator iterates over the data of a time series.
type SeriesIterator interface {
    // At returns the current timestamp/value pair.
    At() (t int64, v float64)
    // Next advances the iterator by one.
    Next() bool
    Err() error
}

These sets of interfaces allow "streaming" flow inside the process. We no longer have to have a precomputed list of series that hold samples. With this interface each SeriesSet.Next() implementation can fetch series on demand. In a similar way, within each series. we can also dynamically fetch each sample respectively via SeriesIterator.Next.

With this contract, Prometheus can minimize allocated memory, because the PromQL engine can iterate over samples optimally to evaluate the query. In the same way TSDB implements SeriesSet in a way that fetches the series optimally from blocks stored in the filesystem one by one, minimizing allocations.

This is important for the remote read API, as we can reuse the same pattern of streaming using iterators by sending to the client a piece of the response in a form of few chunks for the single series. Because protobuf has no native delimiting logic, we extended proto definition to allow sending set of small protocol buffer messages instead of a single, huge one. We called this mode STREAMED_XOR_CHUNKS remote read while old one is called SAMPLES. Extended protocol means that Prometheus does not need to buffer the whole response anymore. Instead, it can work on each series sequentially and send a single frame per each SeriesSet.Next or batch of SeriesIterator.Next iterations, potentially reusing the same memory pages for next series!

Now, the response of STREAMED_XOR_CHUNKS remote read is a set of Protobuf messages (frames) as presented below:

// ChunkedReadResponse is a response when response_type equals STREAMED_XOR_CHUNKS.
// We strictly stream full series after series, optionally split by time. This means that a single frame can contain
// partition of the single series, but once a new series is started to be streamed it means that no more chunks will
// be sent for previous one.
message ChunkedReadResponse {
  repeated prometheus.ChunkedSeries chunked_series = 1;
}

// ChunkedSeries represents single, encoded time series.
message ChunkedSeries {
  // Labels should be sorted.
  repeated Label labels = 1 [(gogoproto.nullable) = false];
  // Chunks will be in start time order and may overlap.
  repeated Chunk chunks = 2 [(gogoproto.nullable) = false];
}

As you can see the frame does not include raw samples anymore. That's the second improvement we did: We send in the message samples batched in chunks (see this video to learn more about chunks), which are exactly the same chunks we store in the TSDB.

We ended up with the following server algorithm:

  1. Parse request.
  2. Select metrics from TSDB.
  3. For all series:
    • For all samples:
      • Encode into chunks
        • if the frame is >= 1MB; break
    • Marshal ChunkedReadResponse message.
    • Snappy compress
    • Send the message

You can find full design here.

Benchmarks

How does the performance of this new approach compare to the old solution?

Let's compare remote read characteristics between Prometheus 2.12.0 and 2.13.0. As for the initial results presented at the beginning of this article, I was using Prometheus as a server, and a Thanos sidecar as a client of remote read. I was invoking testing remote read request by running gRPC call against Thanos sidecar using grpcurl. Test was performed from my laptop (Lenovo X1 16GB, i7 8th) with Kubernetes in docker (using kind).

The data was artificially generated, and represents highly dynamic 10,000 series (worst case scenario).

The full test bench is available in thanosbench repo.

Memory

Without streaming

Prometheus 2.12.0: Heap-only allocations of single read 8h of 10k series

With streaming

Prometheus 2.13.0: Heap-only allocations of single read 8h of 10k series

Reducing memory was the key item we aimed for with our solution. Instead of allocating GBs of memory, Prometheus buffers roughly 50MB during the whole request, whereas for Thanos there is only a marginal memory use. Thanks to the streamed Thanos gRPC StoreAPI, sidecar is now a very simple proxy.

Additionally, I tried different time ranges and number of series, but as expected I kept seeing a maximum of 50MB in allocations for Prometheus and nothing really visible for Thanos. This proves that our remote read uses constant memory per request no matter how many samples you ask for. Allocated memory per request is also drastically less influenced by the cardinality of the data, so number of series fetched like it used to be.

This allowing easier capacity planning against user traffic, with help of the concurrency limit.

CPU

Without streaming

Prometheus 2.12.0: CPU time of single read 8h of 10k series

With streaming

Prometheus 2.13.0: CPU time of single read 8h of 10k series

During my tests, CPU usage was also improved, with 2x less CPU time used.

Latency

We achieved to reduce remote read request latency as well, thanks to streaming and less encoding.

Remote read request latency for 8h range with 10,000 series:

2.12.0: avg time 2.13.0: avg time
real 0m34.701s 0m8.164s
user 0m7.324s 0m8.181s
sys 0m1.172s 0m0.749s

And with 2h time range:

2.12.0: avg time 2.13.0: avg time
real 0m10.904s 0m4.145s
user 0m6.236s 0m4.322s
sys 0m0.973s 0m0.536s

Additionally to the ~2.5x lower latency, the response is streamed immediately in comparison to the non-streamed version where the client latency was 27s (real minus user time) just on processing and marshaling on Prometheus and on the Thanos side.

Compatibility

Remote read was extended in a backward and forward compatible way. This is thanks to the protobuf and accepted_response_types field which is ignored for older servers. In the same time server works just fine if accepted_response_types is not present by older clients assuming old SAMPLES remote read.

The remote read protocol was extended in a backward and forward compatible way:

  • Prometheus before v2.13.0 will safely ignore the accepted_response_types field provided by newer clients and assume SAMPLES mode.
  • Prometheus after v2.13.0 will default to the SAMPLES mode for older clients that don't provide the accepted_response_types parameter.

Usage

To use the new, streamed remote read in Prometheus v2.13.0, a 3rd party system has to add accepted_response_types = [STREAMED_XOR_CHUNKS] to the request.

Then Prometheus will stream ChunkedReadResponse instead of old message. Each ChunkedReadResponse message is following varint size and fixed size bigendian uint32 for CRC32 Castagnoli checksum.

For Go it is recommended to use the ChunkedReader to read directly from the stream.

Note that storage.remote.read-sample-limit flag is no longer working for STREAMED_XOR_CHUNKS. storage.remote.read-concurrent-limit works as previously.

There also new option storage.remote.read-max-bytes-in-frame which controls the maximum size of each message. It is advised to keep it 1MB as the default as it is recommended by Google to keep protobuf message not larger than 1MB.

As mentioned before, Thanos gains a lot with this improvement. Streamed remote read is added in v0.7.0, so this or any following version, will use streamed remote read automatically whenever Prometheus 2.13.0 or newer is used with the Thanos sidecar.

Next Steps

Release 2.13.0 introduces extended remote read and Prometheus server side implementation, However at the moment of writing there are still few items to do in order to fully get advantage from the extended remote read protocol:

  • Support for client side of Prometheus remote read: In progress
  • Avoid re-encoding of chunks for blocks during remote read: In progress

Summary

To sum up, the main benefits of chunked, streaming of remote read are:

  • Both client and server are capable of using practically constant memory size per request. This is because the Prometheus sends just single small frames one by one instead of the whole response during remote read. This massively helps with capacity planning, especially for a non-compressible resource like memory.
  • Prometheus server does not need to decode chunks to raw samples anymore during remote read. The same for client side for encoding, if the system is reusing native TSDB XOR compression (like Thanos does).

As always, if you have any issues or feedback, feel free to submit a ticket on GitHub or ask questions on the mailing list.

Interview with ForgeRock

Continuing our series of interviews with users of Prometheus, Ludovic Poitou from ForgeRock talks about their monitoring journey.

Can you tell us about yourself and what ForgeRock does?

I’m Ludovic Poitou, Director of Product Management at ForgeRock, based near Grenoble, France. ForgeRock is an international identity and access management software company with more than 500 employees, founded in Norway in 2010, now headquartered in San Francisco, USA. We provide solutions to secure every online interaction with customers, employees, devices and things. We have more than 800 customers from finance companies to government services.

What was your pre-Prometheus monitoring experience?

The ForgeRock Identity Platform has always offered monitoring interfaces. But the platform is composed of 4 main products, each of them had different options. For example, the Directory Services product offered monitoring information through SNMP, JMX or LDAP, or even a RESTful API over HTTP in the most recent versions. Other products only had REST or JMX. As a result, monitoring the whole platform was complex and required tools that were able to integrate those protocols.

Why did you decide to look at Prometheus?

We needed to have a single and common interface for monitoring all our products, but while keeping the existing ones for backward compatibility.

We started to use DropWizard to collect the metrics in all products. At the same time, we were starting to move these products to the cloud and run them in Docker and Kubernetes. So, Prometheus became evident because of its integration with Kubernetes, its simplicity for deployments, and the integration of Grafana. We also looked at Graphite and while we also added support for it in our products, it’s hardly being used by our customers.

How did you transition?

Some of our products were already using the DropWizard library and we had decided to use a common library in all products, so DropWizard was an obvious choice to code the instrumentation. But very quickly, we faced an issue with the data model. Prometheus interface uses dimensions, while we tend to have a hierarchical model for metrics. We also started to use Micrometer and quickly hit some constraints. So we ended up building a custom implementation to collect our metrics using the Micrometer interface. We adapted DropWizard Metrics to meet our requirements and made the adjustments to the DropWizard Prometheus exporter. Now with a single instrumentation we can expose the metrics with dimensions or hierarchically. Then we’ve started building sample Grafana dashboards that our customer can install and customise to have their own monitoring views and alerts.

Access Management ForgeRock's Grafana dashboard

We do continue to offer the previous interfaces, but we strongly encourage our customers to use Prometheus and Grafana.

What improvements have you seen since switching?

The first benefits came from our Quality Engineering team. As they started to test our Prometheus support and the different metrics, they started to enable it by default on all stress and performance tests. They started to customise the Grafana dashboards for the specific tests. Soon after, they started to highlight and point at various metrics to explain some performance issues.

When reproducing the problems in order to understand and fix them, our engineering team used Prometheus as well and extended some dashboards. The whole process gave us a better product and a much better understanding of which metrics are important to monitor and visualise for customers.

What do you think the future holds for ForgeRock and Prometheus?

ForgeRock has started an effort to offer its products and solutions as a service. With that move, monitoring and alerting are becoming even more critical, and of course, our monitoring infrastructure is based on Prometheus. We currently have two levels of monitoring, one per tenant, where we use Prometheus to collect data about one customer environment, and we can expose a set of metrics for that customer. But we have also built a central Prometheus service where metrics from all deployed tenants is pushed, so that our SRE team can have a really good understanding of what and how all customers environments are running. Overall I would say that Prometheus has become our main monitoring service and it serves both our on-premise customers, and ourselves running our solutions as a Service.

Interview with Hostinger

Continuing our series of interviews with users of Prometheus, Donatas Abraitis from Hostinger talks about their monitoring journey.

Can you tell us about yourself and what Hostinger does?

I’m Donatas Abraitis, a systems engineer at Hostinger. Hostinger is a hosting company as the name implies. We have around 30 million clients since 2004 including the 000webhost.com project - free web hosting provider.

What was your pre-Prometheus monitoring experience?

When Hostinger was quite a small company, only Nagios, Cacti, and Ganglia existed at that time in the market as open source monitoring tools. This is like telling young people what a floppy drive is, but Nagios and Cacti are still in development cycle today.

Even though no automation tools existed. Bash + Perl did the job. If you want to scale your team and yourself, automation should never be ignored. No automation - more human manual work involved.

At that time there were around 150 physical servers. To compare, till this day we have around 2000 servers including VMs and physical boxes.

For networking gear, SNMP is still widely used. With the rise of "white box" switches SNMP becomes less necessary, as regular tools can be installed.

Instead of SNMP, you can run node_exporter, or any other exporter inside the switch to expose whatever metrics you need with the human-readable format. Beautiful is better than ugly, right?

We use CumulusOS which is in our case mostly x86 thus there is absolutely no problem to run any kind of Linux stuff.

Why did you decide to look at Prometheus?

In 2015 when we started automating everything that could be automated, we introduced Prometheus to the ecosystem. In the beginning we had a single monitoring box where Alertmanager, Pushgateway, Grafana, Graylog, and rsyslogd were running.

We also evaluated TICK (Telegraf/InfluxDB/Chronograf/Kapacitor) stack as well, but we were not happy with them because of limited functionality at that time and Prometheus looked in many ways simpler and more mature to implement.

How did you transition?

During the transition period from the old monitoring stack (NCG - Nagios/Cacti/Ganglia) we used both systems and finally, we rely only on Prometheus.

We have about 25 community metric exporters + some custom written like lxc_exporter in our fleet. Mostly we expose custom business-related metrics using textfile collector.

What improvements have you seen since switching?

The new setup improved our time resolution from 5 minutes to 15 seconds, which allows us to have fine-grained and quite deep analysis. Even Mean Time To Detect(MTTD) was reduced by a factor of 4.

What do you think the future holds for Hostinger and Prometheus?

As we have grown our infrastructure N times since 2015 the main bottleneck became Prometheus and Alertmanager. Our Prometheus eats about ~2TB of disk space. Hence, if we restart or change the node under the maintenance we miss monitoring data for a while. Currently we run Prometheus version 2.4.2, but in the near future we have a plan to upgrade to 2.6. Especially we are interested in performance and WAL related stuff features. Prometheus restart takes about 10-15 minutes. Not acceptable. Another problem is that if a single location is down we miss monitoring data as well. Thus we decided by implementing highly available monitoring infrastructure: two Prometheus nodes, two Alertmanagers in separate continents.

Our main visualization tool is Grafana. It's critically important that Grafana could query the backup Prometheus node if the primary is down. This is easy as that - put HAProxy in front and accept connections locally.

Another problem: how can we prevent users (developers and other internal staff) from abusing dashboards overloading Prometheus nodes.

Or the backup node if the primary is down - thundering herds problem.

To achieve the desired state we gave a chance for Trickster. This speeds-up dashboard loading time incredible. It caches time series. In our case cache sits in memory, but there are more choices where to store. Even when the primary goes down and you refresh the dashboard, Trickster won't query the second node for the time series which it has in memory cached. Trickster sits between Grafana and Prometheus. It just talks with Prometheus API.

Hostinger Graphing Architecture

Prometheus nodes are independent while Alertmanager nodes form a cluster. If both Alertmanagers see the same alert they will deduplicate and fire once instead of multiple times.

We have plans to run plenty of blackbox_exporters and monitor every Hostinger client's website because anything that cannot be monitored cannot be assessed.

We are looking forward to implementing more Prometheus nodes in the future so sharding nodes between multiple Prometheus instances. This would allow us to not have a bottleneck if one instance per region is down.

Subquery Support

Introduction

As the title suggests, a subquery is a part of a query, and allows you to do a range query within a query, which was not possible before. It has been a long-standing feature request: prometheus/prometheus/1227.

The pull request for subquery support was recently merged into Prometheus and will be available in Prometheus 2.7. Let’s learn more about it below.

Motivation

Sometimes, there are cases when you want to spot a problem using rate with lower resolution/range (e.g. 5m) while aggregating this data for higher range (e.g. max_over_time for 1h).

Previously, the above was not possible for a single PromQL query. If you wanted to have a range selection on a query for your alerting rules or graphing, it would require you to have a recording rule based on that query, and perform range selection on the metrics created by the recording rules. Example: max_over_time(rate(my_counter_total[5m])[1h]).

When you want some quick results on data spanning days or weeks, it can be quite a bit of a wait until you have enough data in your recording rules before it can be used. Forgetting to add recording rules can be frustrating. And it would be tedious to create a recording rule for each step of a query.

With subquery support, all the waiting and frustration is taken care of.

Subqueries

A subquery is similar to a /api/v1/query_range API call, but embedded within an instant query. The result of a subquery is a range vector.

The Prometheus team arrived at a consensus for the syntax of subqueries at the Prometheus Dev Summit 2018 held in Munich. These are the notes of the summit on subquery support, and a brief design doc for the syntax used for implementing subquery support.

<instant_query> '[' <range> ':' [ <resolution> ] ']' [ offset <duration> ]
  • <instant_query> is equivalent to query field in /query_range API.
  • <range> and offset <duration> is similar to a range selector.
  • <resolution> is optional, which is equivalent to step in /query_range API.

When the resolution is not specified, the global evaluation interval is taken as the default resolution for the subquery. Also, the step of the subquery is aligned independently, and does not depend on the parent query's evaluation time.

Examples

The subquery inside the min_over_time function returns the 5-minute rate of the http_requests_total metric for the past 30 minutes, at a resolution of 1 minute. This would be equivalent to a /query_range API call with query=rate(http_requests_total[5m]), end=<now>, start=<now>-30m, step=1m, and taking the min of all received values.

min_over_time( rate(http_requests_total[5m])[30m:1m] )

Breakdown:

  • rate(http_requests_total[5m])[30m:1m] is the subquery, where rate(http_requests_total[5m]) is the query to be executed.
  • rate(http_requests_total[5m]) is executed from start=<now>-30m to end=<now>, at a resolution of 1m. Note that start time is aligned independently with step of 1m (aligned steps are 0m 1m 2m 3m ...).
  • Finally the result of all the evaluations above are passed to min_over_time().

Below is an example of a nested subquery, and usage of default resolution. The innermost subquery gets the rate of distance_covered_meters_total over a range of time. We use that to get deriv() of the rates, again for a range of time. And finally take the max of all the derivatives. Note that the <now> time for the innermost subquery is relative to the evaluation time of the outer subquery on deriv().

max_over_time( deriv( rate(distance_covered_meters_total[1m])[5m:1m] )[10m:] )

In most cases you would require the default evaluation interval, which is the interval at which rules are evaluated by default. Custom resolutions will be helpful in cases where you want to compute less/more frequently, e.g. expensive queries which you might want to compute less frequently.

Epilogue

Though subqueries are very convenient to use in place of recording rules, using them unnecessarily has performance implications. Heavy subqueries should eventually be converted to recording rules for efficiency.

It is also not recommended to have subqueries inside a recording rule. Rather create more recording rules if you do need to use subqueries in a recording rule.

Interview with Presslabs

Continuing our series of interviews with users of Prometheus, Mile Rosu from Presslabs talks about their monitoring journey.

Can you tell us about yourself and what Presslabs does?

Presslabs is a high-performance managed WordPress hosting platform targeted at publishers, Enterprise brands and digital agencies which seek to offer a seamless experience to their website visitors, 100% of the time.

Recently, we have developed an innovative component to our core product—WordPress Business Intelligence. Users can now get real—time, actionable data in a comprehensive dashboard to support a short issue-to-deployment process and continuous improvement of their sites.

We support the seamless delivery of up to 2 billion pageviews per month, on a fleet of 100 machines entirely dedicated to managed WordPress hosting for demanding customers.

We’re currently on our mission to bring the best experience to WordPress publishers around the world. In this journey, Kubernetes facilitates our route to an upcoming standard in high availability WordPress hosting infrastructure.

What was your pre-Prometheus monitoring experience?

We started building our WordPress hosting platform back in 2009. At the time, we were using Munin, an open-source system, network and infrastructure monitoring that performed all the operations we needed: exposing, collecting, aggregating, alerting and visualizing metrics. Although it performed well, collecting once every minute and aggregating once every 5 minutes was too slow for us, thus the output it generated wasn’t enough to properly analyze events on our platform.

Graphite was our second choice on the list, which solved the time challenge addressed by Munin. We added collectd in to the mix to expose metrics, and used Graphite to collect and aggregate it.

Then we made Viz, a tool we’ve written in JavaScript & Python for visualisation and alerting. However, we stopped actively using this service because maintaining it was a lot of work, which Grafana substituted very well, since its first version.

Presslab's Viz

Since the second half of 2017, our Presslabs platform entered a large-scale transition phase. One of the major changes was our migration to Kubernetes which implied the need for a highly performing monitoring system. That’s when we got our minds set on Prometheus which we’re using every since and plan to integrate it across all our services on the new platform as a central piece for extracting and exposing metrics.

Why did you decide to look at Prometheus?

We started considering Prometheus in 2014 at Velocity Europe Barcelona after speaking to a team of engineers at Soundcloud. The benefits they exposed were compelling enough for us to give Prometheus a try.

How did you transition?

We’re still in the transition process, thus we run in parallel the two systems—Prometheus and the Graphite-collectd combo. For the client dashboard and our core services we use Prometheus, yet, for the client sites we still use Graphite-collectd. On top of both there is a Grafana for visualization.

Presslab's Redis Grafana dashboards

The Prometheus docs, Github issues and the source-code were the go-to resources for integrating Prometheus; of course, StackOverflow added some spice to the process, which satisfied a lot of our curiosities.

The only problem with Prometheus is that we can’t get long-term storage for certain metrics. Our hosting infrastructure platform needs to store usage metrics such as pageviews for at least a year. However, the Prometheus landscape has improved a lot since we’re using it and we still have to test possible solutions.

What improvements have you seen since switching?

Since switching to Prometheus, we’ve noticed a significant decrease in resource usage, compared to any other alternative we’ve used before. Moreover, it’s easy to install since the auto-integration with Kubernetes saves a lot of time.

What do you think the future holds for Presslabs and Prometheus?

We have big plans with Prometheus as we’re working on replacing the Prometheus Helm chart we use right now with the Prometheus Operator on our new infrastructure. The implementation will provide a segregation of the platform customers as we are going to allocate a dedicated Prometheus server for a limited number of websites. We’re already working on that as part of our effort of Kubernetizing WordPress.

We are also working on exporting WordPress metrics in the Prometheus format. Grafana is here to stay, as it goes hand in hand with Prometheus to solve the visualisation need.

Prometheus Graduates Within CNCF

We are happy to announce that as of today, Prometheus graduates within the CNCF.

Prometheus is the second project ever to make it to this tier. By graduating Prometheus, CNCF shows that it's confident in our code and feature velocity, our maturity and stability, and our governance and community processes. This also acts as an external verification of quality for anyone in internal discussions around choice of monitoring tool.

Since reaching incubation level, a lot of things happened; some of which stand out:

  • We completely rewrote our storage back-end to support high churn in services
  • We had a large push towards stability, especially with 2.3.2
  • We started a documentation push with a special focus on making Prometheus adoption and joining the community easier

Especially the last point is important as we currently enter our fourth phase of adoption. These phases were adoption by

  1. Monitoring-centric users actively looking for the very best in monitoring
  2. Hyperscale users facing a monitoring landscape which couldn't keep up with their scale
  3. Companies from small to Fortune 50 redoing their monitoring infrastructure
  4. Users lacking funding and/or resources to focus on monitoring, but hearing about the benefits of Prometheus from various places

Looking into the future, we anticipate even wider adoption and remain committed to handling tomorrow's scale, today.

Implementing Custom Service Discovery

Implementing Custom Service Discovery

Prometheus contains built in integrations for many service discovery (SD) systems such as Consul, Kubernetes, and public cloud providers such as Azure. However, we can’t provide integration implementations for every service discovery option out there. The Prometheus team is already stretched thin supporting the current set of SD integrations, so maintaining an integration for every possible SD option isn’t feasible. In many cases the current SD implementations have been contributed by people outside the team and then not maintained or tested well. We want to commit to only providing direct integration with service discovery mechanisms that we know we can maintain, and that work as intended. For this reason, there is currently a moratorium on new SD integrations.

However, we know there is still a desire to be able to integrate with other SD mechanisms, such as Docker Swarm. Recently a small code change plus an example was committed to the documentation directory within the Prometheus repository for implementing a custom service discovery integration without having to merge it into the main Prometheus binary. The code change allows us to make use of the internal Discovery Manager code to write another executable that interacts with a new SD mechanism and outputs a file that is compatible with Prometheus' file_sd. By co-locating Prometheus and our new executable we can configure Prometheus to read the file_sd-compatible output of our executable, and therefore scrape targets from that service discovery mechanism. In the future this will enable us to move SD integrations out of the main Prometheus binary, as well as to move stable SD integrations that make use of the adapter into the Prometheus discovery package.

Integrations using file_sd, such as those that are implemented with the adapter code, are listed here.

Let’s take a look at the example code.

Adapter

First we have the file adapter.go. You can just copy this file for your custom SD implementation, but it's useful to understand what's happening here.

// Adapter runs an unknown service discovery implementation and converts its target groups
// to JSON and writes to a file for file_sd.
type Adapter struct {
    ctx     context.Context
    disc    discovery.Discoverer
    groups  map[string]*customSD
    manager *discovery.Manager
    output  string
    name    string
    logger  log.Logger
}

// Run starts a Discovery Manager and the custom service discovery implementation.
func (a *Adapter) Run() {
    go a.manager.Run()
    a.manager.StartCustomProvider(a.ctx, a.name, a.disc)
    go a.runCustomSD(a.ctx)
}

The adapter makes use of discovery.Manager to actually start our custom SD provider’s Run function in a goroutine. Manager has a channel that our custom SD will send updates to. These updates contain the SD targets. The groups field contains all the targets and labels our custom SD executable knows about from our SD mechanism.

type customSD struct {
    Targets []string          `json:"targets"`
    Labels  map[string]string `json:"labels"`
}

This customSD struct exists mostly to help us convert the internal Prometheus targetgroup.Group struct into JSON for the file_sd format.

When running, the adapter will listen on a channel for updates from our custom SD implementation. Upon receiving an update, it will parse the targetgroup.Groups into another map[string]*customSD, and compare it with what’s stored in the groups field of Adapter. If the two are different, we assign the new groups to the Adapter struct, and write them as JSON to the output file. Note that this implementation assumes that each update sent by the SD implementation down the channel contains the full list of all target groups the SD knows about.

Custom SD Implementation

Now we want to actually use the Adapter to implement our own custom SD. A full working example is in the same examples directory here.

Here you can see that we’re importing the adapter code "github.com/prometheus/prometheus/documentation/examples/custom-sd/adapter" as well as some other Prometheus libraries. In order to write a custom SD we need an implementation of the Discoverer interface.

// Discoverer provides information about target groups. It maintains a set
// of sources from which TargetGroups can originate. Whenever a discovery provider
// detects a potential change, it sends the TargetGroup through its channel.
//
// Discoverer does not know if an actual change happened.
// It does guarantee that it sends the new TargetGroup whenever a change happens.
//
// Discoverers should initially send a full set of all discoverable TargetGroups.
type Discoverer interface {
    // Run hands a channel to the discovery provider(consul,dns etc) through which it can send
    // updated target groups.
    // Must returns if the context gets canceled. It should not close the update
    // channel on returning.
    Run(ctx context.Context, up chan<- []*targetgroup.Group)
}

We really just have to implement one function, Run(ctx context.Context, up chan<- []*targetgroup.Group). This is the function the manager within the Adapter code will call within a goroutine. The Run function makes use of a context to know when to exit, and is passed a channel for sending it's updates of target groups.

Looking at the Run function within the provided example, we can see a few key things happening that we would need to do in an implementation for another SD. We periodically make calls, in this case to Consul (for the sake of this example, assume there isn’t already a built-in Consul SD implementation), and convert the response to a set of targetgroup.Group structs. Because of the way Consul works, we have to first make a call to get all known services, and then another call per service to get information about all the backing instances.

Note the comment above the loop that’s calling out to Consul for each service:

// Note that we treat errors when querying specific consul services as fatal for for this
// iteration of the time.Tick loop. It's better to have some stale targets than an incomplete
// list of targets simply because there may have been a timeout. If the service is actually
// gone as far as consul is concerned, that will be picked up during the next iteration of
// the outer loop.

With this we’re saying that if we can’t get information for all of the targets, it’s better to not send any update at all than to send an incomplete update. We’d rather have a list of stale targets for a small period of time and guard against false positives due to things like momentary network issues, process restarts, or HTTP timeouts. If we do happen to get a response from Consul about every target, we send all those targets on the channel. There is also a helper function parseServiceNodes that takes the Consul response for an individual service and creates a target group from the backing nodes with labels.

Using the current example

Before starting to write your own custom SD implementation it’s probably a good idea to run the current example after having a look at the code. For the sake of simplicity, I usually run both Consul and Prometheus as Docker containers via docker-compose when working with the example code.

docker-compose.yml

version: '2'
services:
consul:
    image: consul:latest
    container_name: consul
    ports:
    - 8300:8300
    - 8500:8500
    volumes:
    - ${PWD}/consul.json:/consul/config/consul.json
prometheus:
    image: prom/prometheus:latest
    container_name: prometheus
    volumes:
    - ./prometheus.yml:/etc/prometheus/prometheus.yml
    ports:
    - 9090:9090

consul.json

{
"service": {
    "name": "prometheus",
    "port": 9090,
    "checks": [
    {
        "id": "metrics",
        "name": "Prometheus Server Metrics",
        "http": "http://prometheus:9090/metrics",
        "interval": "10s"
    }
    ]

}
}

If we start both containers via docker-compose and then run the example main.go, we’ll query the Consul HTTP API at localhost:8500, and the filesd compatible file will be written as customsd.json. We could configure Prometheus to pick up this file via the file_sd config:

scrape_configs:
  - job_name: "custom-sd"
    scrape_interval: "15s"
    file_sd_configs:
    - files:
      - /path/to/custom_sd.json

Interview with Datawire

Continuing our series of interviews with users of Prometheus, Richard Li from Datawire talks about how they transitioned to Prometheus.

Can you tell us about yourself and what Datawire does?

At Datawire, we make open source tools that help developers code faster on Kubernetes. Our projects include Telepresence, for local development of Kubernetes services; Ambassador, a Kubernetes-native API Gateway built on the Envoy Proxy; and Forge, a build/deployment system.

We run a number of mission critical cloud services in Kubernetes in AWS to support our open source efforts. These services support use cases such as dynamically provisioning dozens of Kubernetes clusters a day, which are then used by our automated test infrastructure.

What was your pre-Prometheus monitoring experience?

We used AWS CloudWatch. This was easy to set up, but we found that as we adopted a more distributed development model (microservices), we wanted more flexibility and control. For example, we wanted each team to be able to customize their monitoring on an as-needed basis, without requiring operational help.

Why did you decide to look at Prometheus?

We had two main requirements. The first was that we wanted every engineer here to be able to have operational control and visibility into their service(s). Our development model is highly decentralized by design, and we try to avoid situations where an engineer needs to wait on a different engineer in order to get something done. For monitoring, we wanted our engineers to be able to have a lot of flexibility and control over their metrics infrastructure. Our second requirement was a strong ecosystem. A strong ecosystem generally means established (and documented) best practices, continued development, and lots of people who can help if you get stuck.

Prometheus, and in particular, the Prometheus Operator, fit our requirements. With the Prometheus Operator, each developer can create their own Prometheus instance as needed, without help from operations (no bottleneck!). We are also members of the CNCF with a lot of experience with the Kubernetes and Envoy communities, so looking at another CNCF community in Prometheus was a natural fit.

Datawire's Ambassador dashboards

How did you transition?

We knew we wanted to start by integrating Prometheus with our API Gateway. Our API Gateway uses Envoy for proxying, and Envoy automatically emits metrics using the statsd protocol. We installed the Prometheus Operator (some detailed notes here) and configured it to start collecting stats from Envoy. We also set up a Grafana dashboard based on some work from another Ambassador contributor.

What improvements have you seen since switching?

Our engineers now have visibility into L7 traffic. We also are able to use Prometheus to compare latency and throughput for our canary deployments to give us more confidence that new versions of our services don’t cause performance regressions.

What do you think the future holds for Datawire and Prometheus?

Using the Prometheus Operator is still a bit complicated. We need to figure out operational best practices for our service teams (when do you deploy a Prometheus?). We’ll then need to educate our engineers on these best practices and train them on how to configure the Operator to meet their needs. We expect this will be an area of some experimentation as we figure out what works and what doesn’t work.

Interview with Scalefastr

Continuing our series of interviews with users of Prometheus, Kevin Burton from Scalefastr talks about how they are using Prometheus.

Can you tell us about yourself and what Scalefastr does?

My name is Kevin Burton and I’m the CEO of Scalefastr. My background is in distributed systems and I’ve previously ran Datastreamer, a company that built a petabyte scale distributed social media crawler and search engine.

At Datastreamer we ran into scalability issues regarding our infrastructure and built out a high performance cluster based on Debian, Elasticsearch, Cassandra, and Kubernetes.

We found that many of our customers were also struggling with their infrastructure and I was amazed at how much they were paying for hosting large amounts of content on AWS and Google Cloud.

We continually evaluated what it costs to run in the cloud and for us our hosting costs would have been about 5-10x what we currently pay.

We made the decision to launch a new cloud platform based on Open Source and cloud native technologies like Kubernetes, Prometheus, Elasticsearch, Cassandra, Grafana, Etcd, etc.

We’re currently hosting a few customers in the petabyte scale and are soft launching our new platform this month.

What was your pre-Prometheus monitoring experience?

At Datastreamer we found that metrics were key to our ability to iterate quickly. The observability into our platform became something we embraced and we integrated tools like Dropwizard Metrics to make it easy to develop analytics for our platform.

We built a platform based on KairosDB, Grafana, and our own (simple) visualization engine which worked out really well for quite a long time.

They key problem we saw with KairosDB was the rate of adoption and customer demand for Prometheus.

Additionally, what’s nice about Prometheus is the support for exporters implemented by either the projects themselves or the community.

With KairosDB we would often struggle to build out our own exporters. The chance that an exporter for KairosDB already existing was rather low compared to Prometheus.

For example, there is CollectD support for KairosDB but it’s not supported very well in Debian and there are practical bugs with CollectD that prevent it from working reliability in production.

With Prometheus you can get up and running pretty quickly (the system is rather easy to install), and the chance that you have an exporter ready for your platform is pretty high.

Additionally, we’re expecting customer applications to start standardizing on Prometheus metrics once there are hosted platforms like Scalefastr which integrate it as a standardized and supported product.

Having visibility into your application performance is critical and the high scalability of Prometheus is necessary to make that happen.

Why did you decide to look at Prometheus?

We were initially curious how other people were monitoring their Kubernetes and container applications.

One of the main challenges of containers is the fact that they can come and go quickly leaving behind both log and metric data that needs to be analyzed.

It became clear that we should investigate Prometheus as our analytics backend once we saw that people were successfully using Prometheus in production along with a container-first architecture - as well as the support for exporters and dashboards.

One of Scalefastr's Grafana dashboards

How did you transition?

The transition was somewhat painless for us since Scalefastr is a greenfield environment.

The architecture for the most part is new with very few limiting factors.

Our main goal is to deploy on bare metal but build cloud features on top of existing and standardized hardware.

The idea is to have all analytics in our cluster backed by Prometheus.

We provide customers with their own “management” infrastructure which includes Prometheus, Grafana, Elasticsearch, and Kibana as well as a Kubernetes control plane. We orchestrate this system with Ansible which handles initial machine setup (ssh, core Debian packages, etc.) and baseline configuration.

We then deploy Prometheus, all the required exporters for the customer configuration, and additionally dashboards for Grafana.

One thing we found to be somewhat problematic is that a few dashboards on Grafana.com were written for Prometheus 1.x and did not port cleanly to 2.x. It turns out that there are only a few functions not present in the 2.x series and many of them just need a small tweak here and there. Additionally, some of the dashboards were written for an earlier version of Grafana.

To help solve that we announced a project this week to standardize and improve dashboards for Prometheus for tools like Cassandra, Elasticsearch, the OS, but also Prometheus itself. We open sourced this and published it to Github last week.

We’re hoping this makes it easy for other people to migrate to Prometheus.

One thing we want to improve is to automatically sync it with our Grafana backend but also to upload these dashboards to Grafana.com.

We also published our Prometheus configuration so that the labels work correctly with our Grafana templates. This allows you to have a pull down menu to select more specific metrics like cluster name, instance name, etc.

Using template variables in Grafana dashboards

What improvements have you seen since switching?

The ease of deployment, high performance, and standardized exporters made it easy for us to switch. Additionally, the fact that the backend is fairly easy to configure (basically, just the daemon itself) and there aren’t many moving parts made it an easy decision.

What do you think the future holds for Scalefastr and Prometheus?

Right now we’re deploying Elasticsearch and Cassandra directly on bare metal. We’re working to run these in containers directly on top of Kubernetes and working toward using the Container Storage Interface (CSI) to make this possible.

Before we can do this we need to get Prometheus service discovery working and this is something we haven’t played with yet. Currently we deploy and configure Prometheus via Ansible but clearly this won’t scale (or even work) with Kubernetes since containers can come and go as our workload changes.

We’re also working on improving the standard dashboards and alerting. One of the features we would like to add (maybe as a container) is support for alerting based on holts winters forecasting.

This would essentially allow us to predict severe performance issues before they happen. Rather than waiting for something to fail (like running out of disk space) until we take action to correct it.

To a certain extent Kubernetes helps with this issue since we can just add nodes to the cluster based on a watermark. Once resource utilization is too high we can just auto-scale.

We’re very excited about the future of Prometheus especially now that we’re moving forward on the 2.x series and the fact that CNCF collaboration seems to be moving forward nicely.

Prometheus at CloudNativeCon 2017

Prometheus at CloudNativeCon 2017

Wednesday 6th December is Prometheus Day at CloudNativeCon Austin, and we’ve got a fantastic lineup of talks and events for you. Go to the Prometheus Salon for hands on advice on how best to monitor Kubernetes, attend a series of talks on various aspects of Prometheus and then hang out with some of the Prometheus developers at the CNCF booth, all followed by the Prometheus Happy Hour. Read on for more details...

Announcing Prometheus 2.0

Announcing Prometheus 2.0

Nearly one and a half years ago, we released Prometheus 1.0 into the wild. The release marked a significant milestone for the project. We had reached a broad set of features that make up Prometheus' simple yet extremely powerful monitoring philosophy.

Since then we added and improved on various service discovery integrations, extended PromQL, and experimented with a first iteration on remote APIs to enable pluggable long-term storage solutions.

But what else has changed to merit a new major release?

PromCon 2017 Recap

What happened

Two weeks ago, Prometheus users and developers from all over the world came together in Munich for PromCon 2017, the second conference around the Prometheus monitoring system. The purpose of this event was to exchange knowledge and best practices and build professional connections around monitoring with Prometheus. Google's Munich office offered us a much larger space this year, which allowed us to grow from 80 to 220 attendees while still selling out!

Take a look at the recap video to get an impression of the event:

Prometheus 2.0 Alpha.3 with New Rule Format

Today we release the third alpha version of Prometheus 2.0. Aside from a variety of bug fixes in the new storage layer, it contains a few planned breaking changes.

Flag Changes

First, we moved to a new flag library, which uses the more common double-dash -- prefix for flags instead of the single dash Prometheus used so far. Deployments have to be adapted accordingly. Additionally, some flags were removed with this alpha. The full list since Prometheus 1.0.0 is:

  • web.telemetry-path
  • All storage.remote.* flags
  • All storage.local.* flags
  • query.staleness-delta
  • alertmanager.url

Recording Rules changes

Alerting and recording rules are one of the critical features of Prometheus. But they also come with a few design issues and missing features, namely:

  • All rules ran with the same interval. We could have some heavy rules that are better off being run at a 10-minute interval and some rules that could be run at 15-second intervals.

  • All rules were evaluated concurrently, which is actually Prometheus’ oldest open bug. This has a couple of issues, the obvious one being that the load spikes every eval interval if you have a lot of rules. The other being that rules that depend on each other might be fed outdated data. For example:

instance:network_bytes:rate1m = sum by(instance) (rate(network_bytes_total[1m]))

ALERT HighNetworkTraffic
  IF instance:network_bytes:rate1m > 10e6
  FOR 5m

Here we are alerting over instance:network_bytes:rate1m, but instance:network_bytes:rate1m is itself being generated by another rule. We can get expected results only if the alert HighNetworkTraffic is run after the current value for instance:network_bytes:rate1m gets recorded.

  • Rules and alerts required users to learn yet another DSL.

To solve the issues above, grouping of rules has been proposed long back but has only recently been implemented as a part of Prometheus 2.0. As part of this implementation we have also moved the rules to the well-known YAML format, which also makes it easier to generate alerting rules based on common patterns in users’ environments.

Here’s how the new format looks:

groups:
- name: my-group-name
  interval: 30s   # defaults to global interval
  rules:
  - record: instance:errors:rate5m
    expr: rate(errors_total[5m])
  - record: instance:requests:rate5m
    expr: rate(requests_total[5m])
  - alert: HighErrors
    # Expressions remain PromQL as before and can be spread over
    # multiple lines via YAML’s multi-line strings.
    expr: |
      sum without(instance) (instance:errors:rate5m)
      / 
      sum without(instance) (instance:requests:rate5m)
    for: 5m
    labels:
      severity: critical
    annotations:
      description: "stuff's happening with {{ $labels.service }}"      

The rules in each group are executed sequentially and you can have an evaluation interval per group.

As this change is breaking, we are going to release it with the 2.0 release and have added a command to promtool for the migration: promtool update rules <filenames> The converted files have the .yml suffix appended and the rule_files clause in your Prometheus configuration has to be adapted.

Help us moving towards the Prometheus 2.0 stable release by testing this new alpha version! You can report bugs on our issue tracker and provide general feedback via our community channels.

Interview with L’Atelier Animation

Continuing our series of interviews with users of Prometheus, Philippe Panaite and Barthelemy Stevens from L’Atelier Animation talk about how they switched their animation studio from a mix of Nagios, Graphite and InfluxDB to Prometheus.

Can you tell us about yourself and what L’Atelier Animation does?

L’Atelier Animation is a 3D animation studio based in the beautiful city of Montreal Canada. Our first feature film "Ballerina" (also known as "Leap") was released worldwide in 2017, US release is expected later this year.

We’re currently hard at work on an animated TV series and on our second feature film.   Our infrastructure consists of around 300 render blades, 150 workstations and twenty various servers. With the exception of a couple of Macs, everything runs on Linux (CentOS) and not a single Windows machine.  


What was your pre-Prometheus monitoring experience?

  At first we went with a mix of Nagios, Graphite, and InfluxDB. The initial setup was “ok” but nothing special and over complicated (too many moving parts).  

Why did you decide to look at Prometheus?

  When we switched all of our services to CentOS 7, we looked at new monitoring solutions and Prometheus came up for many reasons, but most importantly:

  • Node Exporter: With its customization capabilities, we can fetch any data from clients
  • SNMP support: Removes the need for a 3rd party SNMP service
  • Alerting system: ByeBye Nagios
  • Grafana support

How did you transition?

When we finished our first film we had a bit of a downtime so it was a perfect opportunity for our IT department to make big changes. We decided to flush our whole monitoring system as it was not as good as we wanted.  

One of the most important part is to monitor networking equipment so we started by configuring snmp_exporter to fetch data from one of our switches. The calls to NetSNMP that the exporter makes are different under CentOS so we had to re-compile some of the binaries, we did encounter small hiccups here and there but with the help of Brian Brazil from Robust Perception, we got everything sorted out quickly. Once we got snmp_exporter working, we were able to easily add new devices and fetch SNMP data. We now have our core network monitored in Grafana (including 13 switches, 10 VLANs).

Switch metrics from SNMP data

After that we configured node_exporter as we required analytics on workstations, render blades and servers. In our field, when a CPU is not at 100% it’s a problem, we want to use all the power we can so in the end temperature is more critical. Plus, we need as much uptime as possible so all our stations have email alerts setup via Prometheus’s Alertmanager so we’re aware when anything is down.

Dashboard for one workstation

Our specific needs require us to monitor custom data from clients, it’s made easy through the use of node_exporter’s textfile collector function. A cronjob outputs specific data from any given tool into a pre-formatted text file in a format readable by Prometheus.  

Since all the data is available through the HTTP protocol, we wrote a Python script to fetch data from Prometheus. We store it in a MySQL database accessed via a web application that creates a live floor map. This allows us to know with a simple mouse over which user is seated where with what type of hardware. We also created another page with user’s picture & department information, it helps new employees know who’s their neighbour. The website is still an ongoing project so please don’t judge the look, we’re sysadmins after all not web designers :-)

Floormap with workstation detail

What improvements have you seen since switching?

It gave us an opportunity to change the way we monitor everything in the studio and inspired us to create a new custom floor map with all the data which has been initially fetched by Prometheus. The setup is a lot simpler with one service to rule them all.

What do you think the future holds for L’Atelier Animation and Prometheus?

We’re currently in the process of integrating software licenses usage with Prometheus. The information will give artists a good idea of whom is using what and where.

We will continue to customize and add new stuff to Prometheus by user demand and since we work with artists, we know there will be plenty :-) With SNMP and the node_exporter’s custom text file inputs, the possibilities are endless...

Interview with iAdvize

Continuing our series of interviews with users of Prometheus, Laurent COMMARIEU from iAdvize talks about how they replaced their legacy Nagios and Centreon monitoring with Prometheus.

Can you tell us about iAdvize does?

I am Laurent COMMARIEU, a system engineer at iAdvize. I work within the 60 person R&D department in a team of 5 system engineers. Our job is mainly to ensure that applications, services and the underlying system are up and running. We are working with developers to ensure the easiest path for their code to production, and provide the necessary feedback at every step. That’s where monitoring is important.

iAdvize is a full stack conversational commerce platform. We provide an easy way for a brand to centrally interact with their customers, no matter the communication channel (chat, call, video, Facebook Pages, Facebook Messenger, Twitter, Instagram, WhatsApp, SMS, etc...). Our customers work in ecommerce, banks, travel, fashion, etc. in 40 countries. We are an international company of 200 employees with offices in France, UK, Germany, Spain and Italy. We raised $16 Million in 2015.

What was your pre-Prometheus monitoring experience?

I joined iAdvize in February 2016. Previously I worked in companies specialized in network and application monitoring. We were working with opensource software like Nagios, Cacti, Centreon, Zabbix, OpenNMS, etc. and some non-free ones like HP NNM, IBM Netcool suite, BMC Patrol, etc.

iAdvize used to delegate monitoring to an external provider. They ensured 24/7 monitoring using Nagios and Centreon. This toolset was working fine with the legacy static architecture (barebone servers, no VMs, no containers). To complete this monitoring stack, we also use Pingdom.

With the moving our monolithic application towards a Microservices architecture (using Docker) and our will to move our current workload to an infrastructure cloud provider we needed to have more control and flexibility on monitoring. At the same time, iAdvize recruited 3 people, which grew the infrastructure team from 2 to 5. With the old system it took at least a few days or a week to add some new metrics into Centreon and had a real cost (time and money).

Why did you decide to look at Prometheus?

We knew Nagios and the like were not a good choice. Prometheus was the rising star at the time and we decided to PoC it. Sensu was also on the list at the beginning but Prometheus seemed more promising for our use cases.

We needed something able to integrate with Consul, our service discovery system. Our micro services already had a /health route; adding a /metrics endpoint was simple. For about every tool we used, an exporter was available (MySQL, Memcached, Redis, nginx, FPM, etc.).

On paper it looked good.

One of iAdvize's Grafana dashboards

How did you transition?

First of all, we had to convince the developers team (40 people) that Prometheus was the right tool for the job and that they had to add an exporter to their apps. So we did a little demo on RabbitMQ, we installed a RabbitMQ exporter and built a simple Grafana dashboard to display usage metrics to developers. A Python script was written to create some queue and publish/consume messages.

They were quite impressed to see queues and the messages appear in real time. Before that, developers didn't have access to any monitoring data. Centreon was restricted by our infrastructure provider. Today, Grafana is available to everyone at iAdvize, using the Google Auth integration to authenticate. There are 78 active accounts on it (from dev teams to the CEO).

After we started monitoring existing services with Consul and cAdvisor, we monitored the actual presence of the containers. They were monitored using Pingdom checks but it wasn't enough.

We developed a few custom exporters in Go to scrape some business metrics from our databases (MySQL and Redis).

Soon enough, we were able to replace all the legacy monitoring by Prometheus.

One of iAdvize's Grafana dashboards

What improvements have you seen since switching?

Business metrics became very popular and during sales periods everyone is connected to Grafana to see if we're gonna beat some record. We monitor the number of simultaneous conversations, routing errors, agents connected, the number of visitors loading the iAdvize tag, calls on our API gateway, etc.

We worked for a month to optimize our MySQL servers with analysis based on the Newrelic exporter and Percona dashboard for grafana. It was a real success, allowing us to discover inefficiencies and perform optimisations that cut database size by 45% and peak latency by 75%.

There are a lot to say. We know if a AMQP queue has no consumer or if it is Filling abnormally. We know when a container restarts.

The visibility is just awesome.

That was just for the legacy platform.

More and more micro services are going to be deployed in the cloud and Prometheus is used to monitor them. We are using Consul to register the services and Prometheus to discover the metrics routes. Everything works like a charm and we are able to build a Grafana dashboard with a lot of critical business, application and system metrics.

We are building a scalable architecture to deploy our services with Nomad. Nomad registers healthy services in Consul and with some tags relabeling we are able to filter those with a tag name "metrics=true". It offers to us a huge gain in time to deploy the monitoring. We have nothing to do ^^.

We also use the EC2 service discovery. It's really useful with auto-scaling groups. We scale and recycle instances and it's already monitored. No more waiting for our external infrastructure provider to notice what happens in production.

We use alertmanager to send some alerts by SMS or in to our Flowdock.

What do you think the future holds for iAdvize and Prometheus?

  • We are waiting for a simple way to add a long term scalable storage for our capacity planning.
  • We have a dream that one day, our auto-scaling will be triggered by Prometheus alerting. We want to build an autonomous system base on response time and business metrics.
  • I used to work with Netuitive, it had a great anomaly detection feature with automatic correlation. It would be great to have some in Prometheus.

Sneak Peak of Prometheus 2.0

In July 2016 Prometheus reached a big milestone with its 1.0 release. Since then, plenty of new features like new service discovery integrations and our experimental remote APIs have been added. We also realized that new developments in the infrastructure space, in particular Kubernetes, allowed monitored environments to become significantly more dynamic. Unsurprisingly, this also brings new challenges to Prometheus and we identified performance bottlenecks in its storage layer.

Over the past few months we have been designing and implementing a new storage concept that addresses those bottlenecks and shows considerable performance improvements overall. It also paves the way to add features such as hot backups.

The changes are so fundamental that it will trigger a new major release: Prometheus 2.0.
Important features and changes beyond the storage are planned before its stable release. However, today we are releasing an early alpha of Prometheus 2.0 to kick off the stabilization process of the new storage.

Release tarballs and Docker containers are now available. If you are interested in the new mechanics of the storage, make sure to read the deep-dive blog post looking under the hood.

This version does not work with old storage data and should not replace existing production deployments. To run it, the data directory must be empty and all existing storage flags except for -storage.local.retention have to be removed.

For example; before:

./prometheus -storage.local.retention=200h -storage.local.memory-chunks=1000000 -storage.local.max-chunks-to-persist=500000 -storage.local.chunk-encoding=2 -config.file=/etc/prometheus.yaml

after:

./prometheus -storage.local.retention=200h -config.file=/etc/prometheus.yaml

This is a very early version and crashes, data corruption, and bugs in general should be expected. Help us move towards a stable release by submitting them to our issue tracker.

The experimental remote storage APIs are disabled in this alpha release. Scraping targets exposing timestamps, such as federated Prometheus servers, does not yet work. The storage format is breaking and will break again between subsequent alpha releases. We plan to document an upgrade path from 1.0 to 2.0 once we are approaching a stable release.

Interview with Europace

Continuing our series of interviews with users of Prometheus, Tobias Gesellchen from Europace talks about how they discovered Prometheus.

Can you tell us about Europace does?

Europace AG develops and operates the web-based EUROPACE financial marketplace, which is Germany’s largest platform for mortgages, building finance products and personal loans. A fully integrated system links about 400 partners – banks, insurers and financial product distributors. Several thousand users execute some 35,000 transactions worth a total of up to €4 billion on EUROPACE every month. Our engineers regularly blog at http://tech.europace.de/ and @EuropaceTech.

What was your pre-Prometheus monitoring experience?

Nagios/Icinga are still in use for other projects, but with the growing number of services and higher demand for flexibility we looked for other solutions. Due to Nagios and Icinga being more centrally maintained, Prometheus matched our aim to have the full DevOps stack in our team and move specific responsibilities from our infrastructure team to the project members.

Why did you decide to look at Prometheus?

Through our activities in the Docker Berlin community we had been in contact with SoundCloud and Julius Volz, who gave us a good overview. The combination of flexible Docker containers with the highly flexible label-based concept convinced us give Prometheus a try. The Prometheus setup was easy enough, and the Alertmanager worked for our needs, so that we didn’t see any reason to try alternatives. Even our little pull requests to improve the integration in a Docker environment and with messaging tools had been merged very quickly. Over time, we added several exporters and Grafana to the stack. We never looked back or searched for alternatives.

Grafana dashboard for Docker Registry

How did you transition?

Our team introduced Prometheus in a new project, so the transition didn’t happen in our team. Other teams started by adding Prometheus side by side to existing solutions and then migrated the metrics collectors step by step. Custom exporters and other temporary services helped during the migration. Grafana existed already, so we didn’t have to consider another dashboard. Some projects still use both Icinga and Prometheus in parallel.

What improvements have you seen since switching?

We had issues using Icinga due to scalability - several teams maintaining a centrally managed solution didn’t work well. Using the Prometheus stack along with the Alertmanager decoupled our teams and projects. The Alertmanager is now able to be deployed in a high availability mode, which is a great improvement to the heart of our monitoring infrastructure.

What do you think the future holds for Europace and Prometheus?

Other teams in our company have gradually adopted Prometheus in their projects. We expect that more projects will introduce Prometheus along with the Alertmanager and slowly replace Icinga. With the inherent flexibility of Prometheus we expect that it will scale with our needs and that we won’t have issues adapting it to future requirements.

Interview with Weaveworks

Continuing our series of interviews with users of Prometheus, Tom Wilkie from Weaveworks talks about how they choose Prometheus and are now building on it.

Can you tell us about Weaveworks?

Weaveworks offers Weave Cloud, a service which "operationalizes" microservices through a combination of open source projects and software as a service.

Weave Cloud consists of:

You can try Weave Cloud free for 60 days. For the latest on our products check out our blog, Twitter, or Slack (invite).

What was your pre-Prometheus monitoring experience?

Weave Cloud was a clean-slate implementation, and as such there was no previous monitoring system. In previous lives the team had used the typical tools such as Munin and Nagios. Weave Cloud started life as a multitenant, hosted version of Scope. Scope includes basic monitoring for things like CPU and memory usage, so I guess you could say we used that. But we needed something to monitor Scope itself...

Why did you decide to look at Prometheus?

We've got a bunch of ex-Google SRE on staff, so there was plenty of experience with Borgmon, and an ex-SoundClouder with experience of Prometheus. We built the service on Kubernetes and were looking for something that would "fit" with its dynamically scheduled nature - so Prometheus was a no-brainer. We've even written a series of blog posts of which why Prometheus and Kubernetes work together so well is the first.

How did you transition?

When we started with Prometheus the Kubernetes service discovery was still just a PR and as such there were few docs. We ran a custom build for a while and kinda just muddled along, working it out for ourselves. Eventually we gave a talk at the London Prometheus meetup on our experience and published a series of blog posts.

We've tried pretty much every different option for running Prometheus. We started off building our own container images with embedded config, running them all together in a single Pod alongside Grafana and Alert Manager. We used ephemeral, in-Pod storage for time series data. We then broke this up into different Pods so we didn't have to restart Prometheus (and lose history) whenever we changed our dashboards. More recently we've moved to using upstream images and storing the config in a Kubernetes config map - which gets updated by our CI system whenever we change it. We use a small sidecar container in the Prometheus Pod to watch the config file and ping Prometheus when it changes. This means we don't have to restart Prometheus very often, can get away without doing anything fancy for storage, and don't lose history.

Still the problem of periodically losing Prometheus history haunted us, and the available solutions such as Kubernetes volumes or periodic S3 backups all had their downsides. Along with our fantastic experience using Prometheus to monitor the Scope service, this motivated us to build a cloud-native, distributed version of Prometheus - one which could be upgraded, shuffled around and survive host failures without losing history. And that’s how Weave Cortex was born.

What improvements have you seen since switching?

Ignoring Cortex for a second, we were particularly excited to see the introduction of the HA Alert Manager; although mainly because it was one of the first non-Weaveworks projects to use Weave Mesh, our gossip and coordination layer.

I was also particularly keen on the version two Kubernetes service discovery changes by Fabian - this solved an acute problem we were having with monitoring our Consul Pods, where we needed to scrape multiple ports on the same Pod.

And I'd be remiss if I didn't mention the remote write feature (something I worked on myself). With this, Prometheus forms a key component of Weave Cortex itself, scraping targets and sending samples to us.

What do you think the future holds for Weaveworks and Prometheus?

For me the immediate future is Weave Cortex, Weaveworks' Prometheus as a Service. We use it extensively internally, and are starting to achieve pretty good query performance out of it. It's running in production with real users right now, and shortly we'll be introducing support for alerting and achieve feature parity with upstream Prometheus. From there we'll enter a beta programme of stabilization before general availability in the middle of the year.

As part of Cortex, we've developed an intelligent Prometheus expression browser, with autocompletion for PromQL and Jupyter-esque notebooks. We're looking forward to getting this in front of more people and eventually open sourcing it.

I've also got a little side project called Loki, which brings Prometheus service discovery and scraping to OpenTracing, and makes distributed tracing easy and robust. I'll be giving a talk about this at KubeCon/CNCFCon Berlin at the end of March.

Interview with Canonical

Continuing our series of interviews with users of Prometheus, Canonical talks about how they are transitioning to Prometheus.

Can you tell us about yourself and what Canonical does?

Canonical is probably best known as the company that sponsors Ubuntu Linux. We also produce or contribute to a number of other open-source projects including MAAS, Juju, and OpenStack, and provide commercial support for these products. Ubuntu powers the majority of OpenStack deployments, with 55% of production clouds and 58% of large cloud deployments.

My group, BootStack, is our fully managed private cloud service. We build and operate OpenStack clouds for Canonical customers.

What was your pre-Prometheus monitoring experience?

We’d used a combination of Nagios, Graphite/statsd, and in-house Django apps. These did not offer us the level of flexibility and reporting that we need in both our internal and customer cloud environments.

Why did you decide to look at Prometheus?

We’d evaluated a few alternatives, including InfluxDB and extending our use of Graphite, but our first experiences with Prometheus proved it to have the combination of simplicity and power that we were looking for. We especially appreciate the convenience of labels, the simple HTTP protocol, and the out of box timeseries alerting. The potential with Prometheus to replace 2 different tools (alerting and trending) with one is particularly appealing.

Also, several of our staff have prior experience with Borgmon from their time at Google which greatly added to our interest!

How did you transition?

We are still in the process of transitioning, we expect this will take some time due to the number of custom checks we currently use in our existing systems that will need to be re-implemented in Prometheus. The most useful resource has been the prometheus.io site documentation.

It took us a while to choose an exporter. We originally went with collectd but ran into limitations with this. We’re working on writing an openstack-exporter now and were a bit surprised to find there is no good, working, example how to write exporter from scratch.

Some challenges we’ve run into are: No downsampling support, no long term storage solution (yet), and we were surprised by the default 2 week retention period. There's currently no tie-in with Juju, but we’re working on it!

What improvements have you seen since switching?

Once we got the hang of exporters, we found they were very easy to write and have given us very useful metrics. For example we are developing an openstack-exporter for our cloud environments. We’ve also seen very quick cross-team adoption from our DevOps and WebOps groups and developers. We don’t yet have alerting in place but expect to see a lot more to come once we get to this phase of the transition.

What do you think the future holds for Canonical and Prometheus?

We expect Prometheus to be a significant part of our monitoring and reporting infrastructure, providing the metrics gathering and storage for numerous current and future systems. We see it potentially replacing Nagios as for alerting.

Interview with JustWatch

Continuing our series of interviews with users of Prometheus, JustWatch talks about how they established their monitoring.

Can you tell us about yourself and what JustWatch does?

For consumers, JustWatch is a streaming search engine that helps to find out where to watch movies and TV shows legally online and in theaters. You can search movie content across all major streaming providers like Netflix, HBO, Amazon Video, iTunes, Google Play, and many others in 17 countries.

For our clients like movie studios or Video on Demand providers, we are an international movie marketing company that collects anonymized data about purchase behavior and movie taste of fans worldwide from our consumer apps. We help studios to advertise their content to the right audience and make digital video advertising a lot more efficient in minimizing waste coverage.

JustWatch logo

Since our launch in 2014 we went from zero to one of the largest 20k websites internationally without spending a single dollar on marketing - becoming the largest streaming search engine worldwide in under two years. Currently, with an engineering team of just 10, we build and operate a fully dockerized stack of about 50 micro- and macro-services, running mostly on Kubernetes.

What was your pre-Prometheus monitoring experience?

At prior companies many of us worked with most of the open-source monitoring products there are. We have quite some experience working with Nagios, Icinga, Zabbix, Monit, Munin, Graphite and a few other systems. At one company I helped build a distributed Nagios setup with Puppet. This setup was nice, since new services automatically showed up in the system, but taking instances out was still painful. As soon as you have some variance in your systems, the host and service based monitoring suites just don’t fit quite well. The label-based approach Prometheus took was something I always wanted to have, but didn’t find before.

Why did you decide to look at Prometheus?

At JustWatch the public Prometheus announcement hit exactly the right time. We mostly had blackbox monitoring for the first few months of the company - CloudWatch for some of the most important internal metrics, combined with a external services like Pingdom for detecting site-wide outages. Also, none of the classical host-based solutions satisfied us. In a world of containers and microservices, host-based tools like Icinga, Thruk or Zabbix felt antiquated and not ready for the job. When we started to investigate whitebox monitoring, some of us luckily attended the Golang Meetup where Julius and Björn announced Prometheus. We quickly set up a Prometheus server and started to instrument our Go services (we use almost only Go for the backend). It was amazing how easy that was - the design felt like being cloud- and service-oriented as a first principle and never got in the way.

How did you transition?

Transitioning wasn't that hard, as timing wise, we were lucky enough to go from no relevant monitoring directly to Prometheus.

The transition to Prometheus was mostly including the Go client into our apps and wrapping the HTTP handlers. We also wrote and deployed several exporters, including the node_exporter and several exporters for cloud provider APIs. In our experience monitoring and alerting is a project that is never finished, but the bulk of the work was done within a few weeks as a side project.

Since the deployment of Prometheus we tend to look into metrics whenever we miss something or when we are designing new services from scratch.

It took some time to fully grasp the elegance of PromQL and labels concept fully, but the effort really paid off.

What improvements have you seen since switching?

Prometheus enlightened us by making it incredibly easy to reap the benefits from whitebox monitoring and label-based canary deployments. The out-of-the-box metrics for many Golang aspects (HTTP Handler, Go Runtime) helped us to get to a return on investment very quickly - goroutine metrics alone saved the day multiple times. The only monitoring component we actually liked before - Grafana - feels like a natural fit for Prometheus and has allowed us to create some very helpful dashboards. We appreciated that Prometheus didn't try to reinvent the wheel but rather fit in perfectly with the best solution out there. Another huge improvement on predecessors was Prometheus's focus on actually getting the math right (percentiles, etc.). In other systems, we were never quite sure if the operations offered made sense. Especially percentiles are such a natural and necessary way of reasoning about microservice performance that it felt great that they get first class treatment.

Database Dashboard

The integrated service discovery makes it super easy to manage the scrape targets. For Kubernetes, everything just works out-of-the-box. For some other systems not running on Kubernetes yet, we use a Consul-based approach. All it takes to get an application monitored by Prometheus is to add the client, expose /metrics and set one simple annotation on the Container/Pod. This low coupling takes out a lot of friction between development and operations - a lot of services are built well orchestrated from the beginning, because it's simple and fun.

The combination of time-series and clever functions make for awesome alerting super-powers. Aggregations that run on the server and treating both time-series, combinations of them and even functions on those combinations as first-class citizens makes alerting a breeze - often times after the fact.

What do you think the future holds for JustWatch and Prometheus?

While we value very much that Prometheus doesn't focus on being shiny but on actually working and delivering value while being reasonably easy to deploy and operate - especially the Alertmanager leaves a lot to be desired yet. Just some simple improvements like simplified interactive alert building and editing in the frontend would go a long way in working with alerts being even simpler.

We are really looking forward to the ongoing improvements in the storage layer, including remote storage. We also hope for some of the approaches taken in Project Prism and Vulcan to be backported to core Prometheus. The most interesting topics for us right now are GCE Service Discovery, easier scaling, and much longer retention periods (even at the cost of colder storage and much longer query times for older events).

We are also looking forward to use Prometheus for more non-technical departments as well. We’d like to cover most of our KPIs with Prometheus to allow everyone to create beautiful dashboards, as well as alerts. We're currently even planning to abuse the awesome alert engine for a new, internal business project as well - stay tuned!

Interview with Compose

Continuing our series of interviews with users of Prometheus, Compose talks about their monitoring journey from Graphite and InfluxDB to Prometheus.

Can you tell us about yourself and what Compose does?

Compose delivers production-ready database clusters as a service to developers around the world. An app developer can come to us and in a few clicks have a multi-host, highly available, automatically backed up and secure database ready in minutes. Those database deployments then autoscale up as demand increases so a developer can spend their time on building their great apps, not on running their database.

We have tens of clusters of hosts across at least two regions in each of AWS, Google Cloud Platform and SoftLayer. Each cluster spans availability zones where supported and is home to around 1000 highly-available database deployments in their own private networks. More regions and providers are in the works.

What was your pre-Prometheus monitoring experience?

Before Prometheus, a number of different metrics systems were tried. The first system we tried was Graphite, which worked pretty well initially, but the sheer volume of different metrics we had to store, combined with the way Whisper files are stored and accessed on disk, quickly overloaded our systems. While we were aware that Graphite could be scaled horizontally relatively easily, it would have been an expensive cluster. InfluxDB looked more promising so we started trying out the early-ish versions of that and it seemed to work well for a good while. Goodbye Graphite.

The earlier versions of InfluxDB had some issues with data corruption occasionally. We semi-regularly had to purge all of our metrics. It wasn’t a devastating loss for us normally, but it was irritating. The continued promises of features that never materialised frankly wore on us.

Why did you decide to look at Prometheus?

It seemed to combine better efficiency with simpler operations than other options.

Pull-based metric gathering puzzled us at first, but we soon realised the benefits. Initially it seemed like it could be far too heavyweight to scale well in our environment where we often have several hundred containers with their own metrics on each host, but by combining it with Telegraf, we can arrange to have each host export metrics for all its containers (as well as its overall resource metrics) via a single Prometheus scrape target.

How did you transition?

We are a Chef shop so we spun up a largish instance with a big EBS volume and then reached right for a community chef cookbook for Prometheus.

With Prometheus up on a host, we wrote a small Ruby script that uses the Chef API to query for all our hosts, and write out a Prometheus target config file. We use this file with a file_sd_config to ensure all hosts are discovered and scraped as soon as they register with Chef. Thanks to Prometheus’ open ecosystem, we were able to use Telegraf out of the box with a simple config to export host-level metrics directly.

We were testing how far a single Prometheus would scale and waiting for it to fall over. It didn’t! In fact it handled the load of host-level metrics scraped every 15 seconds for around 450 hosts across our newer infrastructure with very little resource usage.

We have a lot of containers on each host so we were expecting to have to start to shard Prometheus once we added all memory usage metrics from those too, but Prometheus just kept on going without any drama and still without getting too close to saturating its resources. We currently monitor over 400,000 distinct metrics every 15 seconds for around 40,000 containers on 450 hosts with a single m4.xlarge prometheus instance with 1TB of storage. You can see our host dashboard for this host below. Disk IO on the 1TB gp2 SSD EBS volume will probably be the limiting factor eventually. Our initial guess is well over-provisioned for now, but we are growing fast in both metrics gathered and hosts/containers to monitor.

Prometheus Host Dashboard

At this point the Prometheus server we’d thrown up to test with was vastly more reliable than the InfluxDB cluster we had doing the same job before, so we did some basic work to make it less of a single-point-of-failure. We added another identical node scraping all the same targets, then added a simple failover scheme with keepalived + DNS updates. This was now more highly available than our previous system so we switched our customer-facing graphs to use Prometheus and tore down the old system.

Prometheus-powered memory metrics for PostgresSQL containers in our app

What improvements have you seen since switching?

Our previous monitoring setup was unreliable and difficult to manage. With Prometheus we have a system that’s working well for graphing lots of metrics, and we have team members suddenly excited about new ways to use it rather than wary of touching the metrics system we used before.

The cluster is simpler too, with just two identical nodes. As we grow, we know we’ll have to shard the work across more Prometheus hosts and have considered a few ways to do this.

What do you think the future holds for Compose and Prometheus?

Right now we have only replicated the metrics we already gathered in previous systems - basic memory usage for customer containers as well as host-level resource usage for our own operations. The next logical step is enabling the database teams to push metrics to the local Telegraf instance from inside the DB containers so we can record database-level stats too without increasing number of targets to scrape.

We also have several other systems that we want to get into Prometheus to get better visibility. We run our apps on Mesos and have integrated basic Docker container metrics already, which is better than previously, but we also want to have more of the infrastructure components in the Mesos cluster recording to the central Prometheus so we can have centralised dashboards showing all elements of supporting system health from load balancers right down to app metrics.

Eventually we will need to shard Prometheus. We already split customer deployments among many smaller clusters for a variety of reasons so the one logical option would be to move to a smaller Prometheus server (or a pair for redundancy) per cluster rather than a single global one.

For most reporting needs this is not a big issue as we usually don’t need hosts/containers from different clusters in the same dashboard, but we may keep a small global cluster with much longer retention and just a modest number of down-sampled and aggregated metrics from each cluster’s Prometheus using Recording Rules.

Interview with DigitalOcean

Next in our series of interviews with users of Prometheus, DigitalOcean talks about how they use Prometheus. Carlos Amedee also talked about the social aspects of the rollout at PromCon 2016.

Can you tell us about yourself and what DigitalOcean does?

My name is Ian Hansen and I work on the platform metrics team. DigitalOcean provides simple cloud computing. To date, we’ve created 20 million Droplets (SSD cloud servers) across 13 regions. We also recently released a new Block Storage product.

DigitalOcean logo

What was your pre-Prometheus monitoring experience?

Before Prometheus, we were running Graphite and OpenTSDB. Graphite was used for smaller-scale applications and OpenTSDB was used for collecting metrics from all of our physical servers via Collectd. Nagios would pull these databases to trigger alerts. We do still use Graphite but we no longer run OpenTSDB.

Why did you decide to look at Prometheus?

I was frustrated with OpenTSDB because I was responsible for keeping the cluster online, but found it difficult to guard against metric storms. Sometimes a team would launch a new (very chatty) service that would impact the total capacity of the cluster and hurt my SLAs.

We are able to blacklist/whitelist new metrics coming in to OpenTSDB, but didn’t have a great way to guard against chatty services except for organizational process (which was hard to change/enforce). Other teams were frustrated with the query language and the visualization tools available at the time. I was chatting with Julius Volz about push vs pull metric systems and was sold in wanting to try Prometheus when I saw that I would really be in control of my SLA when I get to determine what I’m pulling and how frequently. Plus, I really really liked the query language.

How did you transition?

We were gathering metrics via Collectd sending to OpenTSDB. Installing the Node Exporter in parallel with our already running Collectd setup allowed us to start experimenting with Prometheus. We also created a custom exporter to expose Droplet metrics. Soon, we had feature parity with our OpenTSDB service and started turning off Collectd and then turned off the OpenTSDB cluster.

People really liked Prometheus and the visualization tools that came with it. Suddenly, my small metrics team had a backlog that we couldn’t get to fast enough to make people happy, and instead of providing and maintaining Prometheus for people’s services, we looked at creating tooling to make it as easy as possible for other teams to run their own Prometheus servers and to also run the common exporters we use at the company.

Some teams have started using Alertmanager, but we still have a concept of pulling Prometheus from our existing monitoring tools.

What improvements have you seen since switching?

We’ve improved our insights on hypervisor machines. The data we could get out of Collectd and Node Exporter is about the same, but it’s much easier for our team of golang developers to create a new custom exporter that exposes data specific to the services we run on each hypervisor.

We’re exposing better application metrics. It’s easier to learn and teach how to create a Prometheus metric that can be aggregated correctly later. With Graphite it’s easy to create a metric that can’t be aggregated in a certain way later because the dot-separated-name wasn’t structured right.

Creating alerts is much quicker and simpler than what we had before, plus in a language that is familiar. This has empowered teams to create better alerting for the services they know and understand because they can iterate quickly.

What do you think the future holds for DigitalOcean and Prometheus?

We’re continuing to look at how to make collecting metrics as easy as possible for teams at DigitalOcean. Right now teams are running their own Prometheus servers for the things they care about, which allowed us to gain observability we otherwise wouldn’t have had as quickly. But, not every team should have to know how to run Prometheus. We’re looking at what we can do to make Prometheus as automatic as possible so that teams can just concentrate on what queries and alerts they want on their services and databases.

We also created Vulcan so that we have long-term data storage, while retaining the Prometheus Query Language that we have built tooling around and trained people how to use.

Interview with ShuttleCloud

Continuing our series of interviews with users of Prometheus, ShuttleCloud talks about how they began using Prometheus. Ignacio from ShuttleCloud also explained how Prometheus Is Good for Your Small Startup at PromCon 2016.

What does ShuttleCloud do?

ShuttleCloud is the world’s most scalable email and contacts data importing system. We help some of the leading email and address book providers, including Google and Comcast, increase user growth and engagement by automating the switching experience through data import.

By integrating our API into their offerings, our customers allow their users to easily migrate their email and contacts from one participating provider to another, reducing the friction users face when switching to a new provider. The 24/7 email providers supported include all major US internet service providers: Comcast, Time Warner Cable, AT&T, Verizon, and more.

By offering end users a simple path for migrating their emails (while keeping complete control over the import tool’s UI), our customers dramatically improve user activation and onboarding.

ShuttleCloud's integration with Gmail ShuttleCloud’s integration with Google’s Gmail Platform. Gmail has imported data for 3 million users with our API.

ShuttleCloud’s technology encrypts all the data required to process an import, in addition to following the most secure standards (SSL, oAuth) to ensure the confidentiality and integrity of API requests. Our technology allows us to guarantee our platform’s high availability, with up to 99.5% uptime assurances.

ShuttleCloud by Numbers

What was your pre-Prometheus monitoring experience?

In the beginning, a proper monitoring system for our infrastructure was not one of our main priorities. We didn’t have as many projects and instances as we currently have, so we worked with other simple systems to alert us if anything was not working properly and get it under control.

  • We had a set of automatic scripts to monitor most of the operational metrics for the machines. These were cron-based and executed, using Ansible from a centralized machine. The alerts were emails sent directly to the entire development team.
  • We trusted Pingdom for external blackbox monitoring and checking that all our frontends were up. They provided an easy interface and alerting system in case any of our external services were not reachable.

Fortunately, big customers arrived, and the SLAs started to be more demanding. Therefore, we needed something else to measure how we were performing and to ensure that we were complying with all SLAs. One of the features we required was to have accurate stats about our performance and business metrics (i.e., how many migrations finished correctly), so reporting was more on our minds than monitoring.

We developed the following system:

Initial Shuttlecloud System

  • The source of all necessary data is a status database in a CouchDB. There, each document represents one status of an operation. This information is processed by the Status Importer and stored in a relational manner in a MySQL database.

  • A component gathers data from that database, with the information aggregated and post-processed into several views.

    • One of the views is the email report, which we needed for reporting purposes. This is sent via email.
    • The other view pushes data to a dashboard, where it can be easily controlled. The dashboard service we used was external. We trusted Ducksboard, not only because the dashboards were easy to set up and looked beautiful, but also because they provided automatic alerts if a threshold was reached.

With all that in place, it didn’t take us long to realize that we would need a proper metrics, monitoring, and alerting system as the number of projects started to increase.

Some drawbacks of the systems we had at that time were:

  • No centralized monitoring system. Each metric type had a different one:
    • System metrics → Scripts run by Ansible.
    • Business metrics → Ducksboard and email reports.
    • Blackbox metrics → Pingdom.
  • No standard alerting system. Each metric type had different alerts (email, push notification, and so on).
  • Some business metrics had no alerts. These were reviewed manually.

Why did you decide to look at Prometheus?

We analyzed several monitoring and alerting systems. We were eager to get our hands dirty and check if the a solution would succeed or fail. The system we decided to put to the test was Prometheus, for the following reasons:

  • First of all, you don’t have to define a fixed metric system to start working with it; metrics can be added or changed in the future. This provides valuable flexibility when you don’t know all of the metrics you want to monitor yet.
  • If you know anything about Prometheus, you know that metrics can have labels that abstract us from the fact that different time series are considered. This, together with its query language, provided even more flexibility and a powerful tool. For example, we can have the same metric defined for different environments or projects and get a specific time series or aggregate certain metrics with the appropriate labels:
    • http_requests_total{job="my_super_app_1",environment="staging"} - the time series corresponding to the staging environment for the app "my_super_app_1".
    • http_requests_total{job="my_super_app_1"} - the time series for all environments for the app "my_super_app_1".
    • http_requests_total{environment="staging"} - the time series for all staging environments for all jobs.
  • Prometheus supports a DNS service for service discovery. We happened to already have an internal DNS service.
  • There is no need to install any external services (unlike Sensu, for example, which needs a data-storage service like Redis and a message bus like RabbitMQ). This might not be a deal breaker, but it definitely makes the test easier to perform, deploy, and maintain.
  • Prometheus is quite easy to install, as you only need to download an executable Go file. The Docker container also works well and it is easy to start.

How do you use Prometheus?

Initially we were only using some metrics provided out of the box by the node_exporter, including:

  • hard drive usage.
  • memory usage.
  • if an instance is up or down.

Our internal DNS service is integrated to be used for service discovery, so every new instance is automatically monitored.

Some of the metrics we used, which were not provided by the node_exporter by default, were exported using the node_exporter textfile collector feature. The first alerts we declared on the Prometheus Alertmanager were mainly related to the operational metrics mentioned above.

We later developed an operation exporter that allowed us to know the status of the system almost in real time. It exposed business metrics, namely the statuses of all operations, the number of incoming migrations, the number of finished migrations, and the number of errors. We could aggregate these on the Prometheus side and let it calculate different rates.

We decided to export and monitor the following metrics:

  • operation_requests_total
  • operation_statuses_total
  • operation_errors_total

Shuttlecloud Prometheus System

We have most of our services duplicated in two Google Cloud Platform availability zones. That includes the monitoring system. It’s straightforward to have more than one operation exporter in two or more different zones, as Prometheus can aggregate the data from all of them and make one metric (i.e., the maximum of all). We currently don’t have Prometheus or the Alertmanager in HA — only a metamonitoring instance — but we are working on it.

For external blackbox monitoring, we use the Prometheus Blackbox Exporter. Apart from checking if our external frontends are up, it is especially useful for having metrics for SSL certificates’ expiration dates. It even checks the whole chain of certificates. Kudos to Robust Perception for explaining it perfectly in their blogpost.

We set up some charts in Grafana for visual monitoring in some dashboards, and the integration with Prometheus was trivial. The query language used to define the charts is the same as in Prometheus, which simplified their creation a lot.

We also integrated Prometheus with Pagerduty and created a schedule of people on-call for the critical alerts. For those alerts that were not considered critical, we only sent an email.

How does Prometheus make things better for you?

We can't compare Prometheus with our previous solution because we didn’t have one, but we can talk about what features of Prometheus are highlights for us:

  • It has very few maintenance requirements.
  • It’s efficient: one machine can handle monitoring the whole cluster.
  • The community is friendly—both dev and users. Moreover, Brian’s blog is a very good resource.
  • It has no third-party requirements; it’s just the server and the exporters. (No RabbitMQ or Redis needs to be maintained.)
  • Deployment of Go applications is a breeze.

What do you think the future holds for ShuttleCloud and Prometheus?

We’re very happy with Prometheus, but new exporters are always welcome (Celery or Spark, for example).

One question that we face every time we add a new alarm is: how do we test that the alarm works as expected? It would be nice to have a way to inject fake metrics in order to raise an alarm, to test it.

PromCon 2016 - It's a wrap!

What happened

Last week, eighty Prometheus users and developers from around the world came together for two days in Berlin for the first-ever conference about the Prometheus monitoring system: PromCon 2016. The goal of this conference was to exchange knowledge, best practices, and experience gained using Prometheus. We also wanted to grow the community and help people build professional connections around service monitoring. Here are some impressions from the first morning:

Pull doesn't scale - or does it?

Let's talk about a particularly persistent myth. Whenever there is a discussion about monitoring systems and Prometheus's pull-based metrics collection approach comes up, someone inevitably chimes in about how a pull-based approach just “fundamentally doesn't scale”. The given reasons are often vague or only apply to systems that are fundamentally different from Prometheus. In fact, having worked with pull-based monitoring at the largest scales, this claim runs counter to our own operational experience.

We already have an FAQ entry about why Prometheus chooses pull over push, but it does not focus specifically on scaling aspects. Let's have a closer look at the usual misconceptions around this claim and analyze whether and how they would apply to Prometheus.

Prometheus is not Nagios

When people think of a monitoring system that actively pulls, they often think of Nagios. Nagios has a reputation of not scaling well, in part due to spawning subprocesses for active checks that can run arbitrary actions on the Nagios host in order to determine the health of a certain host or service. This sort of check architecture indeed does not scale well, as the central Nagios host quickly gets overwhelmed. As a result, people usually configure checks to only be executed every couple of minutes, or they run into more serious problems.

However, Prometheus takes a fundamentally different approach altogether. Instead of executing check scripts, it only collects time series data from a set of instrumented targets over the network. For each target, the Prometheus server simply fetches the current state of all metrics of that target over HTTP (in a highly parallel way, using goroutines) and has no other execution overhead that would be pull-related. This brings us to the next point:

It doesn't matter who initiates the connection

For scaling purposes, it doesn't matter who initiates the TCP connection over which metrics are then transferred. Either way you do it, the effort for establishing a connection is small compared to the metrics payload and other required work.

But a push-based approach could use UDP and avoid connection establishment altogether, you say! True, but the TCP/HTTP overhead in Prometheus is still negligible compared to the other work that the Prometheus server has to do to ingest data (especially persisting time series data on disk). To put some numbers behind this: a single big Prometheus server can easily store millions of time series, with a record of 800,000 incoming samples per second (as measured with real production metrics data at SoundCloud). Given a 10-seconds scrape interval and 700 time series per host, this allows you to monitor over 10,000 machines from a single Prometheus server. The scaling bottleneck here has never been related to pulling metrics, but usually to the speed at which the Prometheus server can ingest the data into memory and then sustainably persist and expire data on disk/SSD.

Also, although networks are pretty reliable these days, using a TCP-based pull approach makes sure that metrics data arrives reliably, or that the monitoring system at least knows immediately when the metrics transfer fails due to a broken network.

Prometheus is not an event-based system

Some monitoring systems are event-based. That is, they report each individual event (an HTTP request, an exception, you name it) to a central monitoring system immediately as it happens. This central system then either aggregates the events into metrics (StatsD is the prime example of this) or stores events individually for later processing (the ELK stack is an example of that). In such a system, pulling would be problematic indeed: the instrumented service would have to buffer events between pulls, and the pulls would have to happen incredibly frequently in order to simulate the same “liveness” of the push-based approach and not overwhelm event buffers.

However, again, Prometheus is not an event-based monitoring system. You do not send raw events to Prometheus, nor can it store them. Prometheus is in the business of collecting aggregated time series data. That means that it's only interested in regularly collecting the current state of a given set of metrics, not the underlying events that led to the generation of those metrics. For example, an instrumented service would not send a message about each HTTP request to Prometheus as it is handled, but would simply count up those requests in memory. This can happen hundreds of thousands of times per second without causing any monitoring traffic. Prometheus then simply asks the service instance every 15 or 30 seconds (or whatever you configure) about the current counter value and stores that value together with the scrape timestamp as a sample. Other metric types, such as gauges, histograms, and summaries, are handled similarly. The resulting monitoring traffic is low, and the pull-based approach also does not create problems in this case.

But now my monitoring needs to know about my service instances!

With a pull-based approach, your monitoring system needs to know which service instances exist and how to connect to them. Some people are worried about the extra configuration this requires on the part of the monitoring system and see this as an operational scalability problem.

We would argue that you cannot escape this configuration effort for serious monitoring setups in any case: if your monitoring system doesn't know what the world should look like and which monitored service instances should be there, how would it be able to tell when an instance just never reports in, is down due to an outage, or really is no longer meant to exist? This is only acceptable if you never care about the health of individual instances at all, like when you only run ephemeral workers where it is sufficient for a large-enough number of them to report in some result. Most environments are not exclusively like that.

If the monitoring system needs to know the desired state of the world anyway, then a push-based approach actually requires more configuration in total. Not only does your monitoring system need to know what service instances should exist, but your service instances now also need to know how to reach your monitoring system. A pull approach not only requires less configuration, it also makes your monitoring setup more flexible. With pull, you can just run a copy of production monitoring on your laptop to experiment with it. It also allows you just fetch metrics with some other tool or inspect metrics endpoints manually. To get high availability, pull allows you to just run two identically configured Prometheus servers in parallel. And lastly, if you have to move the endpoint under which your monitoring is reachable, a pull approach does not require you to reconfigure all of your metrics sources.

On a practical front, Prometheus makes it easy to configure the desired state of the world with its built-in support for a wide variety of service discovery mechanisms for cloud providers and container-scheduling systems: Consul, Marathon, Kubernetes, EC2, DNS-based SD, Azure, Zookeeper Serversets, and more. Prometheus also allows you to plug in your own custom mechanism if needed. In a microservice world or any multi-tiered architecture, it is also fundamentally an advantage if your monitoring system uses the same method to discover targets to monitor as your service instances use to discover their backends. This way you can be sure that you are monitoring the same targets that are serving production traffic and you have only one discovery mechanism to maintain.

Accidentally DDoS-ing your monitoring

Whether you pull or push, any time-series database will fall over if you send it more samples than it can handle. However, in our experience it's slightly more likely for a push-based approach to accidentally bring down your monitoring. If the control over what metrics get ingested from which instances is not centralized (in your monitoring system), then you run into the danger of experimental or rogue jobs suddenly pushing lots of garbage data into your production monitoring and bringing it down. There are still plenty of ways how this can happen with a pull-based approach (which only controls where to pull metrics from, but not the size and nature of the metrics payloads), but the risk is lower. More importantly, such incidents can be mitigated at a central point.

Real-world proof

Besides the fact that Prometheus is already being used to monitor very large setups in the real world (like using it to monitor millions of machines at DigitalOcean), there are other prominent examples of pull-based monitoring being used successfully in the largest possible environments. Prometheus was inspired by Google's Borgmon, which was (and partially still is) used within Google to monitor all its critical production services using a pull-based approach. Any scaling issues we encountered with Borgmon at Google were not due its pull approach either. If a pull-based approach scales to a global environment with many tens of datacenters and millions of machines, you can hardly say that pull doesn't scale.

But there are other problems with pull!

There are indeed setups that are hard to monitor with a pull-based approach. A prominent example is when you have many endpoints scattered around the world which are not directly reachable due to firewalls or complicated networking setups, and where it's infeasible to run a Prometheus server directly in each of the network segments. This is not quite the environment for which Prometheus was built, although workarounds are often possible (via the Pushgateway or restructuring your setup). In any case, these remaining concerns about pull-based monitoring are usually not scaling-related, but due to network operation difficulties around opening TCP connections.

All good then?

This article addresses the most common scalability concerns around a pull-based monitoring approach. With Prometheus and other pull-based systems being used successfully in very large environments and the pull aspect not posing a bottleneck in reality, the result should be clear: the “pull doesn't scale” argument is not a real concern. We hope that future debates will focus on aspects that matter more than this red herring.

Prometheus reaches 1.0

In January, we published a blog post on Prometheus’s first year of public existence, summarizing what has been an amazing journey for us, and hopefully an innovative and useful monitoring solution for you. Since then, Prometheus has also joined the Cloud Native Computing Foundation, where we are in good company, as the second charter project after Kubernetes.

Our recent work has focused on delivering a stable API and user interface, marked by version 1.0 of Prometheus. We’re thrilled to announce that we’ve reached this goal, and Prometheus 1.0 is available today.

What does 1.0 mean for you?

If you have been using Prometheus for a while, you may have noticed that the rate and impact of breaking changes significantly decreased over the past year. In the same spirit, reaching 1.0 means that subsequent 1.x releases will remain API stable. Upgrades won’t break programs built atop the Prometheus API, and updates won’t require storage re-initialization or deployment changes. Custom dashboards and alerts will remain intact across 1.x version updates as well. We’re confident Prometheus 1.0 is a solid monitoring solution. Now that the Prometheus server has reached a stable API state, other modules will follow it to their own stable version 1.0 releases over time.

Fine print

So what does API stability mean? Prometheus has a large surface area and some parts are certainly more mature than others. There are two simple categories, stable and unstable:

Stable as of v1.0 and throughout the 1.x series:

  • The query language and data model
  • Alerting and recording rules
  • The ingestion exposition formats
  • Configuration flag names
  • HTTP API (used by dashboards and UIs)
  • Configuration file format (minus the non-stable service discovery integrations, see below)
  • Alerting integration with Alertmanager 0.1+ for the foreseeable future
  • Console template syntax and semantics

Unstable and may change within 1.x:

  • The remote storage integrations (InfluxDB, OpenTSDB, Graphite) are still experimental and will at some point be removed in favor of a generic, more sophisticated API that allows storing samples in arbitrary storage systems.
  • Several service discovery integrations are new and need to keep up with fast evolving systems. Hence, integrations with Kubernetes, Marathon, Azure, and EC2 remain in beta status and are subject to change. However, changes will be clearly announced.
  • Exact flag meanings may change as necessary. However, changes will never cause the server to not start with previous flag configurations.
  • Go APIs of packages that are part of the server.
  • HTML generated by the web UI.
  • The metrics in the /metrics endpoint of Prometheus itself.
  • Exact on-disk format. Potential changes however, will be forward compatible and transparently handled by Prometheus.

So Prometheus is complete now?

Absolutely not. We have a long roadmap ahead of us, full of great features to implement. Prometheus will not stay in 1.x for years to come. The infrastructure space is evolving rapidly and we fully intend for Prometheus to evolve with it. This means that we will remain willing to question what we did in the past and are open to leave behind things that have lost relevance. There will be new major versions of Prometheus to facilitate future plans like persistent long-term storage, newer iterations of Alertmanager, internal storage improvements, and many things we don’t even know about yet.

Closing thoughts

We want to thank our fantastic community for field testing new versions, filing bug reports, contributing code, helping out other community members, and shaping Prometheus by participating in countless productive discussions. In the end, you are the ones who make Prometheus successful.

Thank you, and keep up the great work!

Prometheus to Join the Cloud Native Computing Foundation

Since the inception of Prometheus, we have been looking for a sustainable governance model for the project that is independent of any single company. Recently, we have been in discussions with the newly formed Cloud Native Computing Foundation (CNCF), which is backed by Google, CoreOS, Docker, Weaveworks, Mesosphere, and other leading infrastructure companies.

Today, we are excited to announce that the CNCF's Technical Oversight Committee voted unanimously to accept Prometheus as a second hosted project after Kubernetes! You can find more information about these plans in the official press release by the CNCF.

By joining the CNCF, we hope to establish a clear and sustainable project governance model, as well as benefit from the resources, infrastructure, and advice that the independent foundation provides to its members.

We think that the CNCF and Prometheus are an ideal thematic match, as both focus on bringing about a modern vision of the cloud.

In the following months, we will be working with the CNCF on finalizing the project governance structure. We will report back when there are more details to announce.

When (not) to use varbit chunks

The embedded time series database (TSDB) of the Prometheus server organizes the raw sample data of each time series in chunks of constant 1024 bytes size. In addition to the raw sample data, a chunk contains some meta-data, which allows the selection of a different encoding for each chunk. The most fundamental distinction is the encoding version. You select the version for newly created chunks via the command line flag -storage.local.chunk-encoding-version. Up to now, there were only two supported versions: 0 for the original delta encoding, and 1 for the improved double-delta encoding. With release 0.18.0, we added version 2, which is another variety of double-delta encoding. We call it varbit encoding because it involves a variable bit-width per sample within the chunk. While version 1 is superior to version 0 in almost every aspect, there is a real trade-off between version 1 and 2. This blog post will help you to make that decision. Version 1 remains the default encoding, so if you want to try out version 2 after reading this article, you have to select it explicitly via the command line flag. There is no harm in switching back and forth, but note that existing chunks will not change their encoding version once they have been created. However, these chunks will gradually be phased out according to the configured retention time and will thus be replaced by chunks with the encoding specified in the command-line flag.

Interview with ShowMax

This is the second in a series of interviews with users of Prometheus, allowing them to share their experiences of evaluating and using Prometheus.

Can you tell us about yourself and what ShowMax does?

I’m Antonin Kral, and I’m leading research and architecture for ShowMax. Before that, I’ve held architectural and CTO roles for the past 12 years.

ShowMax is a subscription video on demand service that launched in South Africa in 2015. We’ve got an extensive content catalogue with more than 20,000 episodes of TV shows and movies. Our service is currently available in 65 countries worldwide. While better known rivals are skirmishing in America and Europe, ShowMax is battling a more difficult problem: how do you binge-watch in a barely connected village in sub-Saharan Africa? Already 35% of video around the world is streamed, but there are still so many places the revolution has left untouched.

ShowMax logo

We are managing about 50 services running mostly on private clusters built around CoreOS. They are primarily handling API requests from our clients (Android, iOS, AppleTV, JavaScript, Samsung TV, LG TV etc), while some of them are used internally. One of the biggest internal pipelines is video encoding which can occupy 400+ physical servers when handling large ingestion batches.

The majority of our back-end services are written in Ruby, Go or Python. We use EventMachine when writing apps in Ruby (Goliath on MRI, Puma on JRuby). Go is typically used in apps that require large throughput and don’t have so much business logic. We’re very happy with Falcon for services written in Python. Data is stored in PostgreSQL and ElasticSearch clusters. We use etcd and custom tooling for configuring Varnishes for routing requests.

Interview with Life360

This is the first in a series of interviews with users of Prometheus, allowing them to share their experiences of evaluating and using Prometheus. Our first interview is with Daniel from Life360.

Can you tell us about yourself and what Life360 does?

I’m Daniel Ben Yosef, a.k.a, dby, and I’m an Infrastructure Engineer for Life360, and before that, I’ve held systems engineering roles for the past 9 years.

Life360 creates technology that helps families stay connected, we’re the Family Network app for families. We’re quite busy handling these families - at peak we serve 700k requests per minute for 70 million registered families.

We manage around 20 services in production, mostly handling location requests from mobile clients (Android, iOS, and Windows Phone), spanning over 150+ instances at peak. Redundancy and high-availability are our goals and we strive to maintain 100% uptime whenever possible because families trust us to be available.

We hold user data in both our MySQL multi-master cluster and in our 12-node Cassandra ring which holds around 4TB of data at any given time. We have services written in Go, Python, PHP, as well as plans to introduce Java to our stack. We use Consul for service discovery, and of course our Prometheus setup is integrated with it.

Custom Alertmanager Templates

The Alertmanager handles alerts sent by Prometheus servers and sends notifications about them to different receivers based on their labels.

A receiver can be one of many different integrations such as PagerDuty, Slack, email, or a custom integration via the generic webhook interface (for example JIRA).

Templates

The messages sent to receivers are constructed via templates. Alertmanager comes with default templates but also allows defining custom ones.

In this blog post, we will walk through a simple customization of Slack notifications.

We use this simple Alertmanager configuration that sends all alerts to Slack:

global:
  slack_api_url: '<slack_webhook_url>'

route:
  receiver: 'slack-notifications'
  # All alerts in a notification have the same value for these labels.
  group_by: [alertname, datacenter, app]

receivers:
- name: 'slack-notifications'
  slack_configs:
  - channel: '#alerts'

By default, a Slack message sent by Alertmanager looks like this:

It shows us that there is one firing alert, followed by the label values of the alert grouping (alertname, datacenter, app) and further label values the alerts have in common (critical).

One Year of Open Prometheus Development

The beginning

A year ago today, we officially announced Prometheus to the wider world. This is a great opportunity for us to look back and share some of the wonderful things that have happened to the project since then. But first, let's start at the beginning.

Although we had already started Prometheus as an open-source project on GitHub in 2012, we didn't make noise about it at first. We wanted to give the project time to mature and be able to experiment without friction. Prometheus was gradually introduced for production monitoring at SoundCloud in 2013 and then saw more and more usage within the company, as well as some early adoption by our friends at Docker and Boxever in 2014. Over the years, Prometheus was growing more and more mature and although it was already solving people's monitoring problems, it was still unknown to the wider public.

Custom service discovery with etcd

In a previous post we introduced numerous new ways of doing service discovery in Prometheus. Since then a lot has happened. We improved the internal implementation and received fantastic contributions from our community, adding support for service discovery with Kubernetes and Marathon. They will become available with the release of version 0.16.

We also touched on the topic of custom service discovery.

Not every type of service discovery is generic enough to be directly included in Prometheus. Chances are your organisation has a proprietary system in place and you just have to make it work with Prometheus. This does not mean that you cannot enjoy the benefits of automatically discovering new monitoring targets.

In this post we will implement a small utility program that connects a custom service discovery approach based on etcd, the highly consistent distributed key-value store, to Prometheus.

Monitoring DreamHack - the World's Largest Digital Festival

Editor's note: This article is a guest post written by a Prometheus user.

If you are operating the network for 10,000's of demanding gamers, you need to really know what is going on inside your network. Oh, and everything needs to be built from scratch in just five days.

If you have never heard about DreamHack before, here is the pitch: Bring 20,000 people together and have the majority of them bring their own computer. Mix in professional gaming (eSports), programming contests, and live music concerts. The result is the world's largest festival dedicated solely to everything digital.

To make such an event possible, there needs to be a lot of infrastructure in place. Ordinary infrastructures of this size take months to build, but the crew at DreamHack builds everything from scratch in just five days. This of course includes stuff like configuring network switches, but also building the electricity distribution, setting up stores for food and drinks, and even building the actual tables.

The team that builds and operates everything related to the network is officially called the Network team, but we usually refer to ourselves as tech or dhtech. This post is going to focus on the work of dhtech and how we used Prometheus during DreamHack Summer 2015 to try to kick our monitoring up another notch.

Practical Anomaly Detection

In his Open Letter To Monitoring/Metrics/Alerting Companies, John Allspaw asserts that attempting "to detect anomalies perfectly, at the right time, is not possible".

I have seen several attempts by talented engineers to build systems to automatically detect and diagnose problems based on time series data. While it is certainly possible to get a demonstration working, the data always turned out to be too noisy to make this approach work for anything but the simplest of real-world systems.

All hope is not lost though. There are many common anomalies which you can detect and handle with custom-built rules. The Prometheus query language gives you the tools to discover these anomalies while avoiding false positives.

Advanced Service Discovery in Prometheus 0.14.0

This week we released Prometheus v0.14.0 — a version with many long-awaited additions and improvements.

On the user side, Prometheus now supports new service discovery mechanisms. In addition to DNS-SRV records, it now supports Consul out of the box, and a file-based interface allows you to connect your own discovery mechanisms. Over time, we plan to add other common service discovery mechanisms to Prometheus.

Aside from many smaller fixes and improvements, you can now also reload your configuration during runtime by sending a SIGHUP to the Prometheus process. For a full list of changes, check the changelog for this release.

In this blog post, we will take a closer look at the built-in service discovery mechanisms and provide some practical examples. As an additional resource, see Prometheus's configuration documentation.

Prometheus Monitoring Spreads through the Internet

It has been almost three months since we publicly announced Prometheus version 0.10.0, and we're now at version 0.13.1.

SoundCloud's announcement blog post remains the best overview of the key components of Prometheus, but there has been a lot of other online activity around Prometheus. This post will let you catch up on anything you missed.

In the future, we will use this blog to publish more articles and announcements to help you get the most out of Prometheus.