Interview with ShowMax
May 1, 2016 by Brian Brazil
This is the second in a series of interviews with users of Prometheus, allowing them to share their experiences of evaluating and using Prometheus.
Can you tell us about yourself and what ShowMax does?
I’m Antonin Kral, and I’m leading research and architecture for ShowMax . Before that, I’ve held architectural and CTO roles for the past 12 years.
ShowMax is a subscription video on demand service that launched in South Africa in 2015. We’ve got an extensive content catalogue with more than 20,000 episodes of TV shows and movies. Our service is currently available in 65 countries worldwide. While better known rivals are skirmishing in America and Europe, ShowMax is battling a more difficult problem: how do you binge-watch in a barely connected village in sub-Saharan Africa? Already 35% of video around the world is streamed, but there are still so many places the revolution has left untouched.

We are managing about 50 services running mostly on private clusters built around CoreOS. They are primarily handling API requests from our clients (Android, iOS, AppleTV, JavaScript, Samsung TV, LG TV etc), while some of them are used internally. One of the biggest internal pipelines is video encoding which can occupy 400+ physical servers when handling large ingestion batches.
The majority of our back-end services are written in Ruby, Go or Python. We use EventMachine when writing apps in Ruby (Goliath on MRI, Puma on JRuby). Go is typically used in apps that require large throughput and don’t have so much business logic. We’re very happy with Falcon for services written in Python. Data is stored in PostgreSQL and ElasticSearch clusters. We use etcd and custom tooling for configuring Varnishes for routing requests.
What was your pre-Prometheus monitoring experience?
The primary use-cases for monitoring systems are:
- Active monitoring and probing (via Icinga)
- Metrics acquisition and creation of alerts based on these metrics (now Prometheus)
- Log acquisition from backend services
- Event and log acquisition from apps
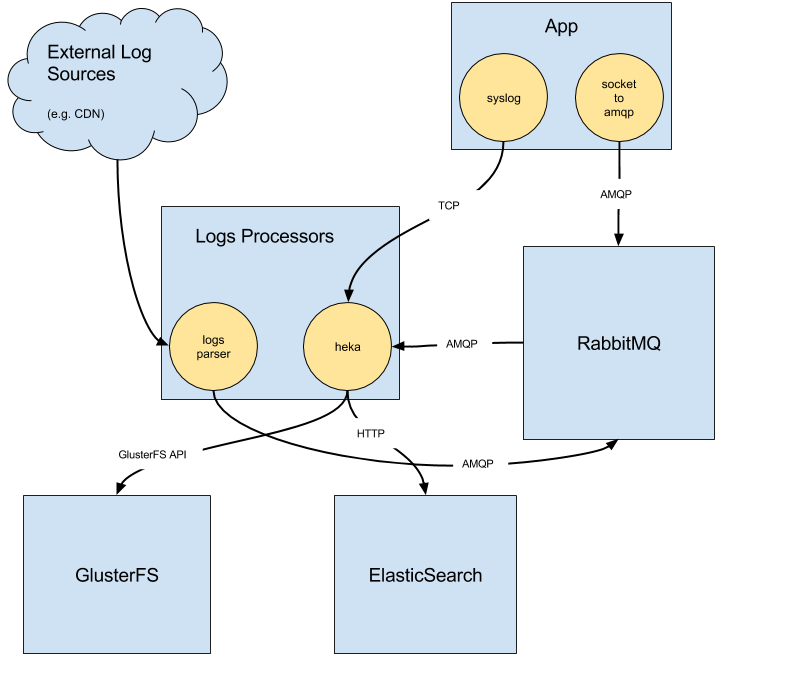
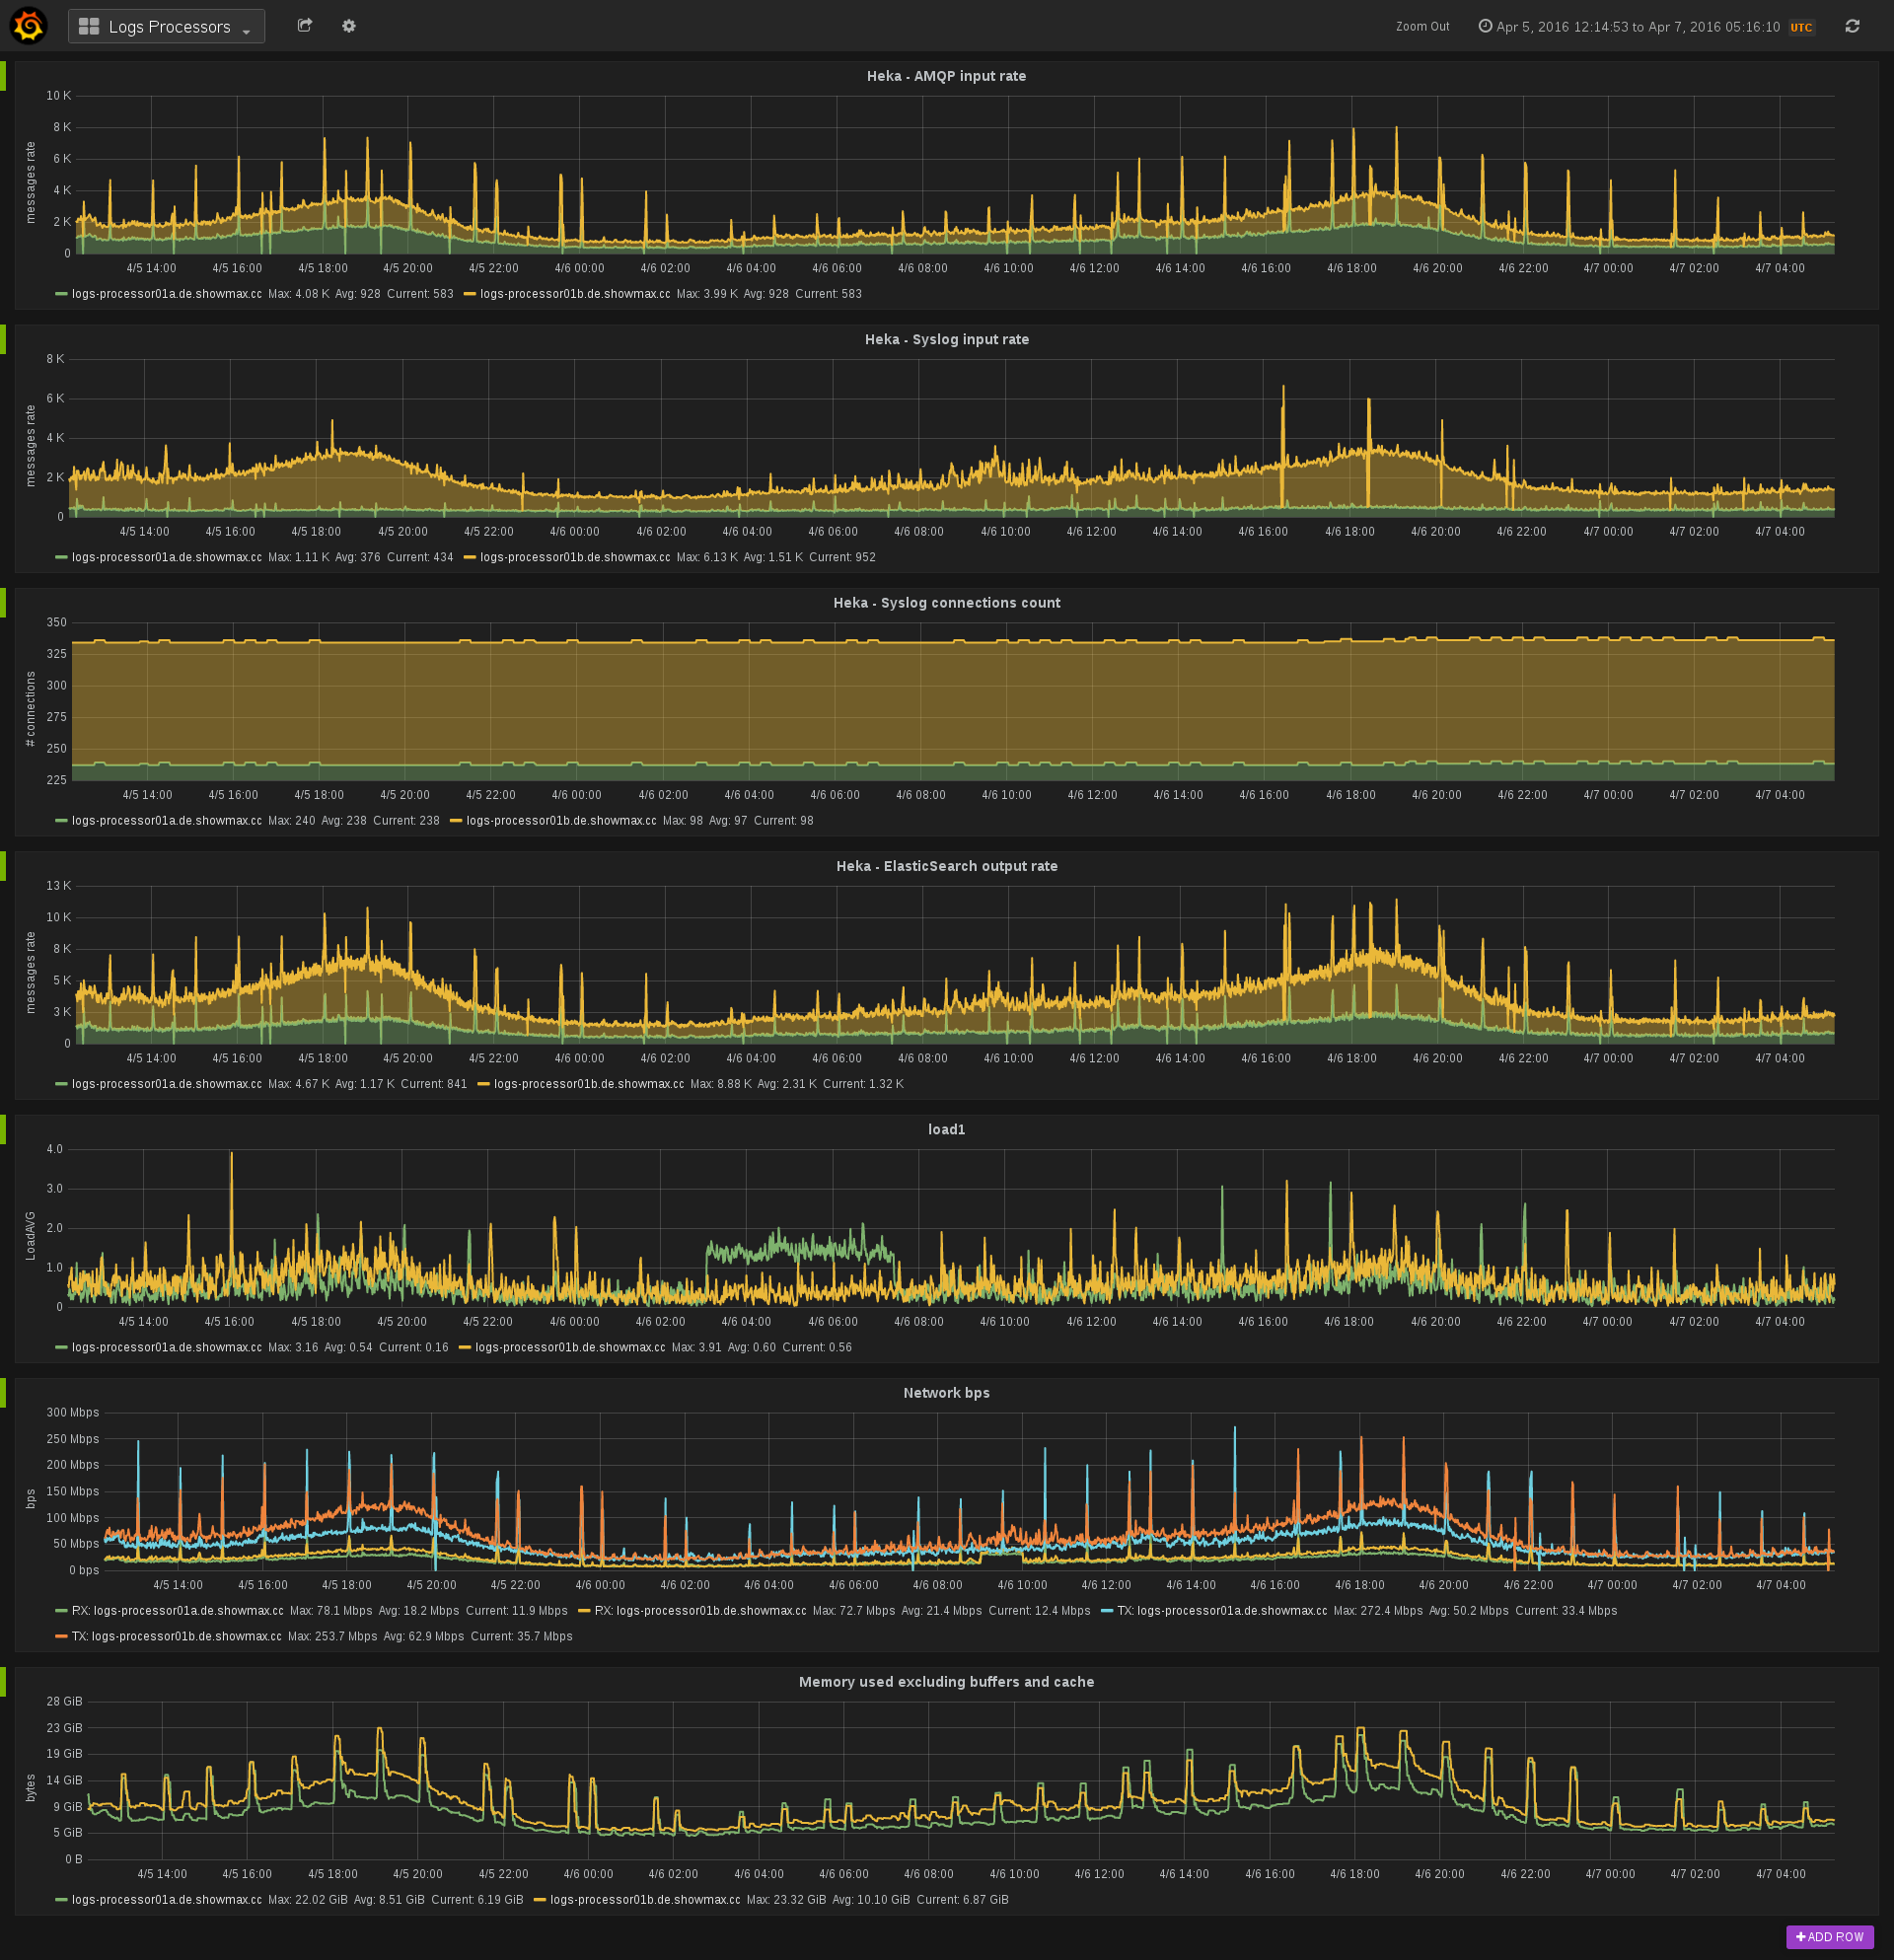
The last two use-cases are handled via our logging infrastructure. It consists of a collector running in the service container, which is listening on local Unix socket. The socket is used by apps to send messages to the outside world. Messages are transferred via RabbitMQ servers to consumers. Consumers are custom written or hekad based. One of the main message flows is going towards the service ElasticSearch cluster, which makes logs accessible for Kibana and ad-hoc searches. We also save all processed events to GlusterFS for archival purposes and/or further processing.
We used to run two metric acquisition pipelines in parallel. The first is based on Collectd + StatsD + Graphite + Grafana and the other using Collectd + OpenTSDB. We have struggled considerably with both pipelines. We had to deal with either the I/O hungriness of Graphite, or the complexity and inadequate tooling around OpenTSDB.
Why did you decide to look at Prometheus?
After learning from our problems with the previous monitoring system, we looked for a replacement. Only a few solutions made it to our shortlist. Prometheus was one of the first, as Jiri Brunclik, our head of Operations at the time, had received a personal recommendation about the system from former colleagues at Google.
The proof of concept went great. We got a working system very quickly. We also evaluated InfluxDB as a main system as well as a long-term storage for Prometheus. But due to recent developments, this may no longer be a viable option for us.
How did you transition?
We initially started with LXC containers on one of our service servers, but quickly moved towards a dedicated server from Hetzner, where we host the majority of our services. We’re using PX70-SSD, which is Intel® Xeon® E3-1270 v3 Quad-Core Haswell with 32GB RAM, so we have plenty of power to run Prometheus. SSDs allow us to have retention set to 120 days. Our logging infrastructure is built around getting logs locally (receiving them on Unix socket) and then pushing them towards the various workers.

Having this infrastructure available made pushing metrics a logical choice (especially in pre-Prometheus times). On the other side, Prometheus is primarily designed around the paradigm of scraping metrics. We wanted to stay consistent and push all metrics towards Prometheus initially. We have created a Go daemon called prometheus-pusher. It’s responsible for scraping metrics from local exporters and pushing them towards the Pushgateway. Pushing metrics has some positive aspects (e.g. simplified service discovery) but also quite a few drawbacks (e.g. making it hard to distinguish between a network partition vs. a crashed service). We made Prometheus-pusher available on GitHub , so you can try it yourself.

The next step was for us to figure out what to use for managing dashboards and graphs. We liked the Grafana integration, but didn’t really like how Grafana manages dashboard configurations. We are running Grafana in a Docker container, so any changes should be kept out of the container. Another problem was the lack of change tracking in Grafana.
We have thus decided to write a generator which takes YAML maintained within git and generates JSON configs for Grafana dashboards. It is furthermore able to deploy dashboards to Grafana started in a fresh container without the need for persisting changes made into the container. This provides you with automation, repeatability, and auditing.
We are pleased to announce that this tool is also now available under an Apache 2.0 license on GitHub .
What improvements have you seen since switching?
An improvement which we saw immediately was the stability of Prometheus. We were fighting with stability and scalability of Graphite prior to this, so getting that sorted was a great win for us. Furthermore the speed and stability of Prometheus made access to metrics very easy for developers. Prometheus is really helping us to embrace the DevOps culture.
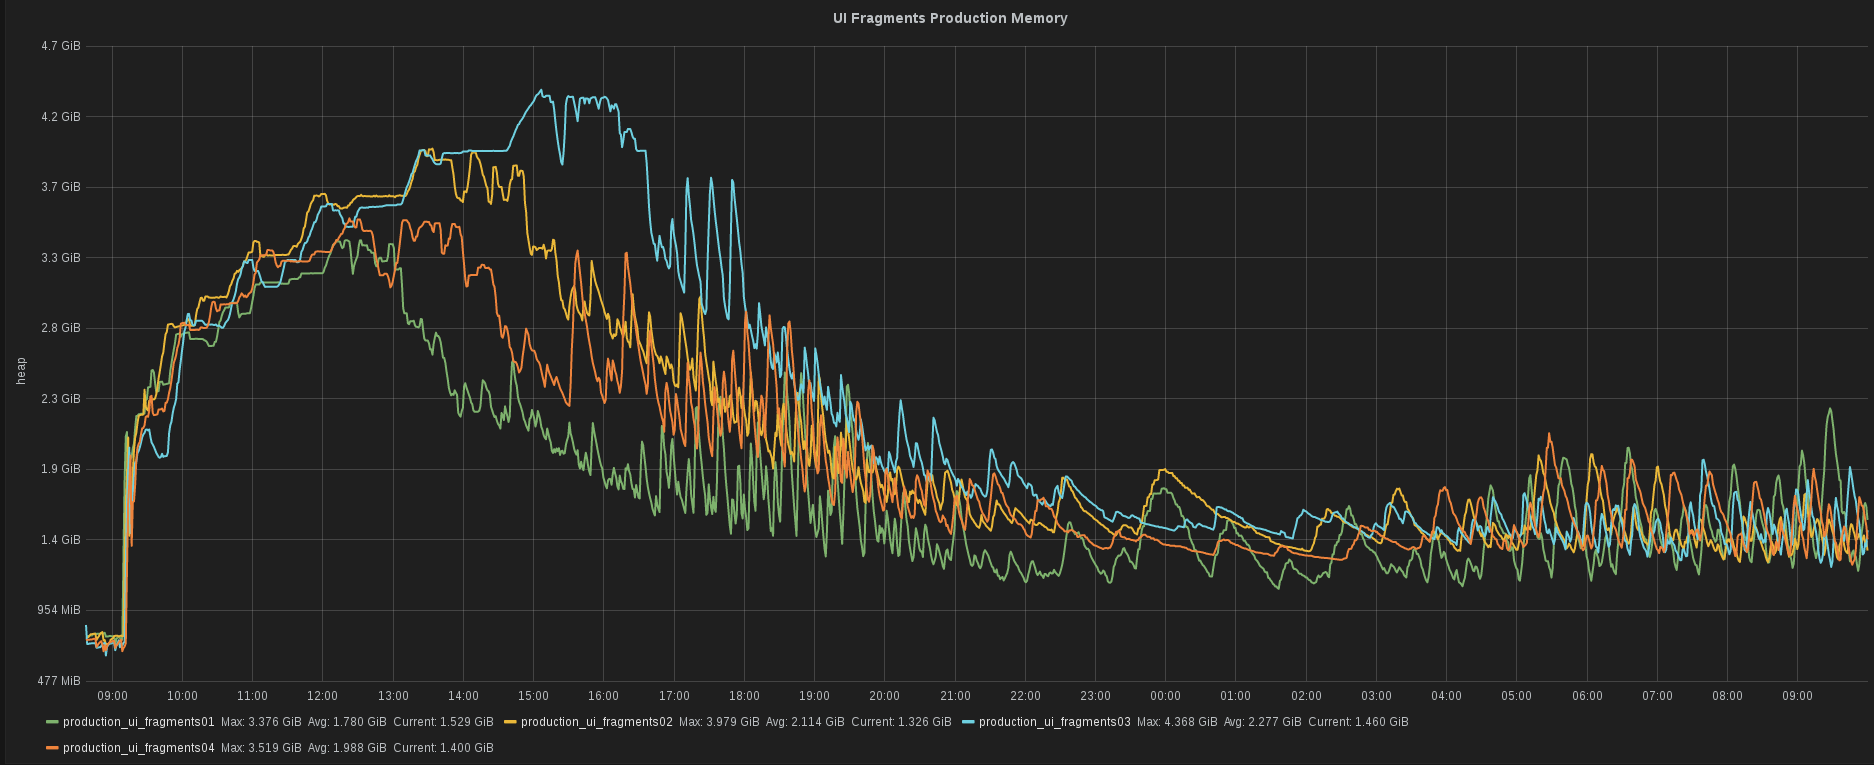
Tomas Cerevka, one of our backend developers, was testing a new version of the service using JRuby. He needed a quick peek into the heap consumption of that particular service. He was able to get that information in a snap. For us, this speed is essential.

What do you think the future holds for ShowMax and Prometheus?
Prometheus has become an integral part of monitoring in ShowMax and it is going to be with us for the foreseeable future. We have replaced our whole metric storage with Prometheus, but the ingestion chain remains push based. We are thus thinking about following Prometheus best practices and switching to a pull model.
We’ve also already played with alerts. We want to spend more time on this topic and come up with increasingly sophisticated alert rules.
