Interview with Datawire
March 16, 2018 by Brian Brazil
Continuing our series of interviews with users of Prometheus, Richard Li from Datawire talks about how they transitioned to Prometheus.
Can you tell us about yourself and what Datawire does?
At Datawire, we make open source tools that help developers code faster on Kubernetes. Our projects include Telepresence , for local development of Kubernetes services; Ambassador , a Kubernetes-native API Gateway built on the Envoy Proxy ; and Forge , a build/deployment system.
We run a number of mission critical cloud services in Kubernetes in AWS to support our open source efforts. These services support use cases such as dynamically provisioning dozens of Kubernetes clusters a day, which are then used by our automated test infrastructure.
What was your pre-Prometheus monitoring experience?
We used AWS CloudWatch. This was easy to set up, but we found that as we adopted a more distributed development model (microservices), we wanted more flexibility and control. For example, we wanted each team to be able to customize their monitoring on an as-needed basis, without requiring operational help.
Why did you decide to look at Prometheus?
We had two main requirements. The first was that we wanted every engineer here to be able to have operational control and visibility into their service(s). Our development model is highly decentralized by design, and we try to avoid situations where an engineer needs to wait on a different engineer in order to get something done. For monitoring, we wanted our engineers to be able to have a lot of flexibility and control over their metrics infrastructure. Our second requirement was a strong ecosystem. A strong ecosystem generally means established (and documented) best practices, continued development, and lots of people who can help if you get stuck.
Prometheus, and in particular, the Prometheus Operator , fit our requirements. With the Prometheus Operator, each developer can create their own Prometheus instance as needed, without help from operations (no bottleneck!). We are also members of the CNCF with a lot of experience with the Kubernetes and Envoy communities, so looking at another CNCF community in Prometheus was a natural fit.
How did you transition?
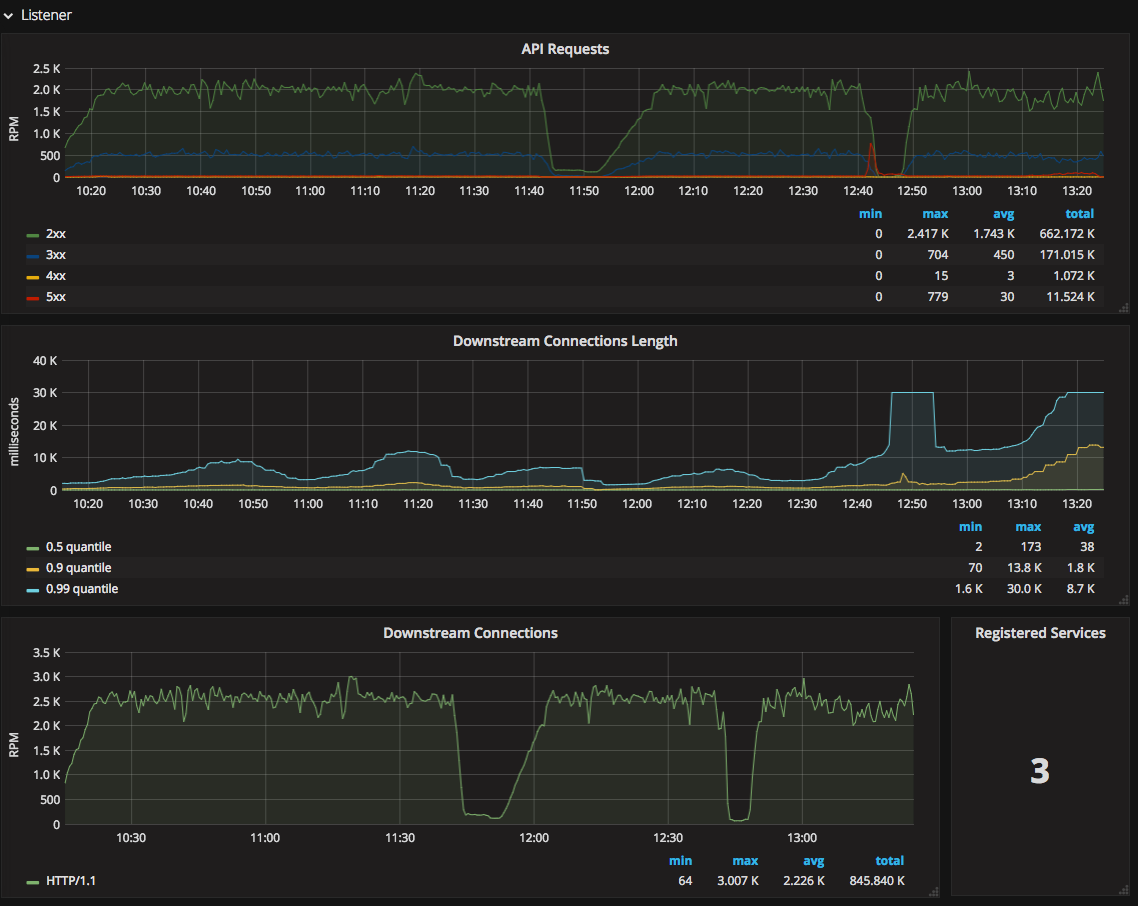
We knew we wanted to start by integrating Prometheus with our API Gateway. Our API Gateway uses Envoy for proxying, and Envoy automatically emits metrics using the statsd protocol. We installed the Prometheus Operator (some detailed notes here ) and configured it to start collecting stats from Envoy. We also set up a Grafana dashboard based on some work from another Ambassador contributor.
What improvements have you seen since switching?
Our engineers now have visibility into L7 traffic. We also are able to use Prometheus to compare latency and throughput for our canary deployments to give us more confidence that new versions of our services don’t cause performance regressions.
What do you think the future holds for Datawire and Prometheus?
Using the Prometheus Operator is still a bit complicated. We need to figure out operational best practices for our service teams (when do you deploy a Prometheus?). We’ll then need to educate our engineers on these best practices and train them on how to configure the Operator to meet their needs. We expect this will be an area of some experimentation as we figure out what works and what doesn’t work.