Interview with Presslabs
August 23, 2018 by Brian Brazil
Continuing our series of interviews with users of Prometheus, Mile Rosu from Presslabs talks about their monitoring journey.
Can you tell us about yourself and what Presslabs does?
Presslabs is a high-performance managed WordPress hosting platform targeted at publishers, Enterprise brands and digital agencies which seek to offer a seamless experience to their website visitors, 100% of the time.
Recently, we have developed an innovative component to our core product—WordPress Business Intelligence. Users can now get real—time, actionable data in a comprehensive dashboard to support a short issue-to-deployment process and continuous improvement of their sites.
We support the seamless delivery of up to 2 billion pageviews per month, on a fleet of 100 machines entirely dedicated to managed WordPress hosting for demanding customers.
We’re currently on our mission to bring the best experience to WordPress publishers around the world. In this journey, Kubernetes facilitates our route to an upcoming standard in high availability WordPress hosting infrastructure.
What was your pre-Prometheus monitoring experience?
We started building our WordPress hosting platform back in 2009. At the time, we were using Munin, an open-source system, network and infrastructure monitoring that performed all the operations we needed: exposing, collecting, aggregating, alerting and visualizing metrics. Although it performed well, collecting once every minute and aggregating once every 5 minutes was too slow for us, thus the output it generated wasn’t enough to properly analyze events on our platform.
Graphite was our second choice on the list, which solved the time challenge addressed by Munin. We added collectd in to the mix to expose metrics, and used Graphite to collect and aggregate it.
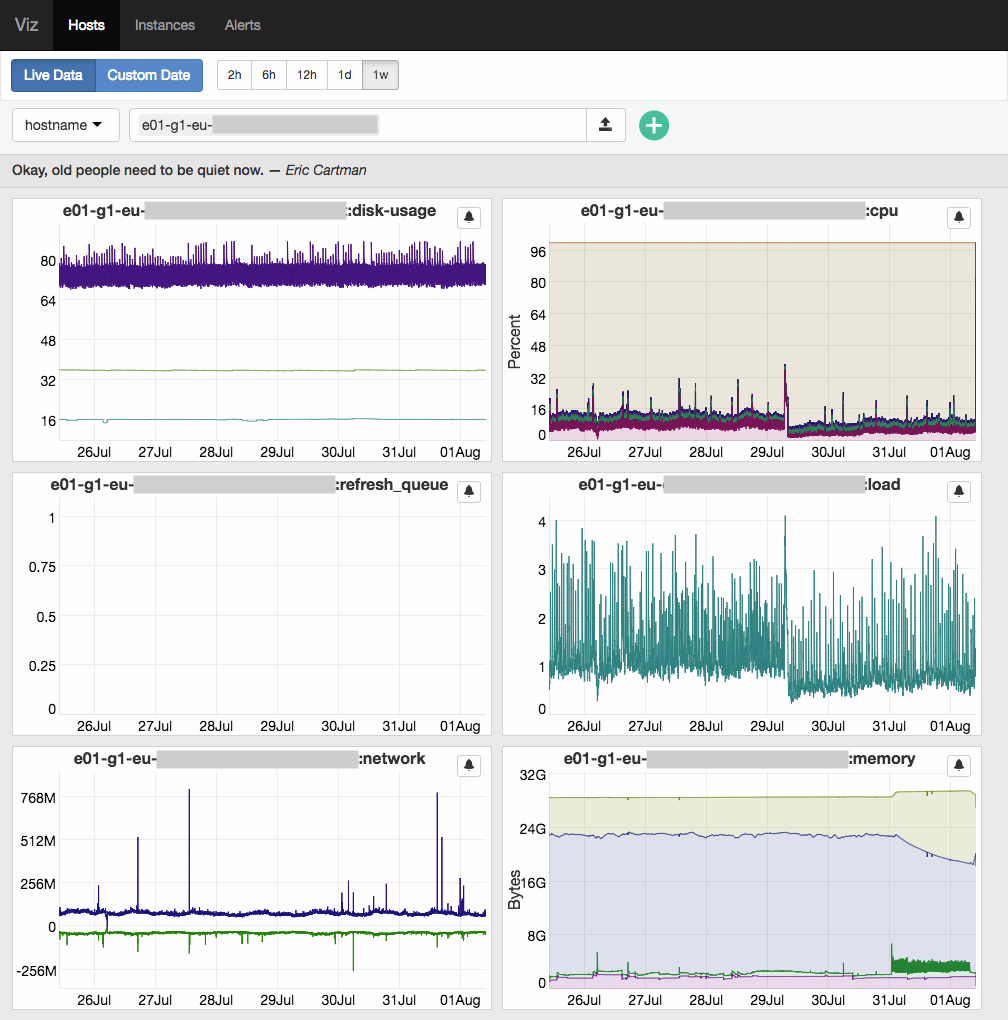
Then we made Viz, a tool we’ve written in JavaScript & Python for visualisation and alerting. However, we stopped actively using this service because maintaining it was a lot of work, which Grafana substituted very well, since its first version.
Since the second half of 2017, our Presslabs platform entered a large-scale transition phase. One of the major changes was our migration to Kubernetes which implied the need for a highly performing monitoring system. That’s when we got our minds set on Prometheus which we’re using every since and plan to integrate it across all our services on the new platform as a central piece for extracting and exposing metrics.
Why did you decide to look at Prometheus?
We started considering Prometheus in 2014 at Velocity Europe Barcelona after speaking to a team of engineers at Soundcloud. The benefits they exposed were compelling enough for us to give Prometheus a try.
How did you transition?
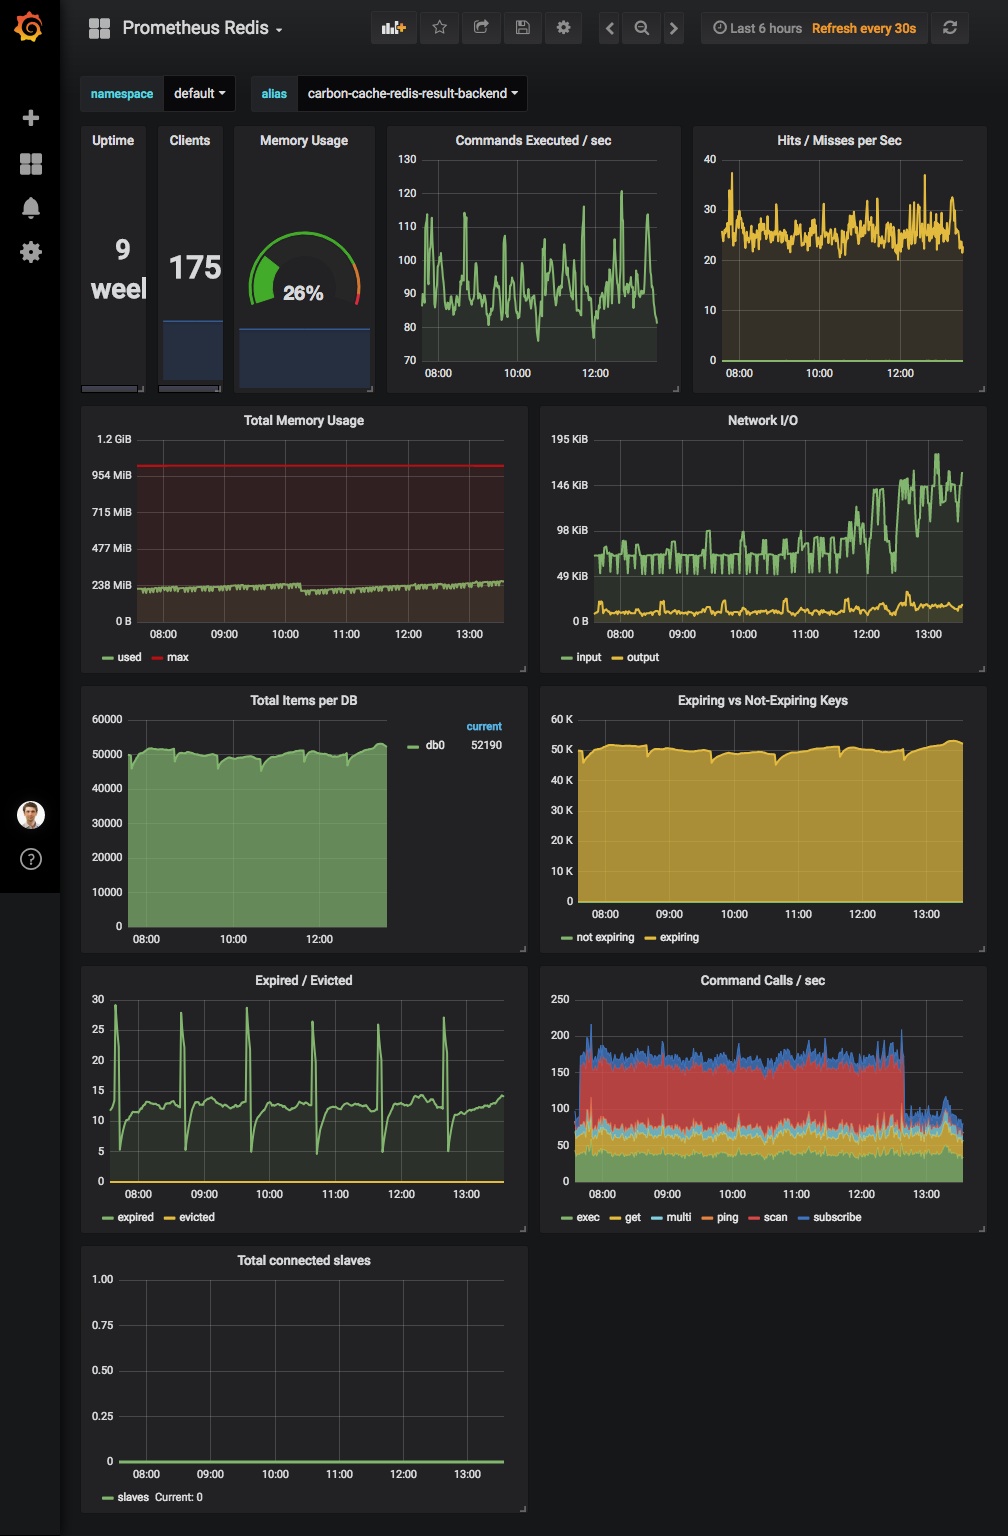
We’re still in the transition process, thus we run in parallel the two systems—Prometheus and the Graphite-collectd combo. For the client dashboard and our core services we use Prometheus, yet, for the client sites we still use Graphite-collectd. On top of both there is a Grafana for visualization.
The Prometheus docs, Github issues and the source-code were the go-to resources for integrating Prometheus; of course, StackOverflow added some spice to the process, which satisfied a lot of our curiosities.
The only problem with Prometheus is that we can’t get long-term storage for certain metrics. Our hosting infrastructure platform needs to store usage metrics such as pageviews for at least a year. However, the Prometheus landscape has improved a lot since we’re using it and we still have to test possible solutions.
What improvements have you seen since switching?
Since switching to Prometheus, we’ve noticed a significant decrease in resource usage, compared to any other alternative we’ve used before. Moreover, it’s easy to install since the auto-integration with Kubernetes saves a lot of time.
What do you think the future holds for Presslabs and Prometheus?
We have big plans with Prometheus as we’re working on replacing the Prometheus Helm chart we use right now with the Prometheus Operator on our new infrastructure. The implementation will provide a segregation of the platform customers as we are going to allocate a dedicated Prometheus server for a limited number of websites. We’re already working on that as part of our effort of Kubernetizing WordPress.
We are also working on exporting WordPress metrics in the Prometheus format. Grafana is here to stay, as it goes hand in hand with Prometheus to solve the visualisation need.