Interview with iAdvize
May 17, 2017 by Brian Brazil
Continuing our series of interviews with users of Prometheus, Laurent COMMARIEU from iAdvize talks about how they replaced their legacy Nagios and Centreon monitoring with Prometheus.
Can you tell us about iAdvize does?
I am Laurent COMMARIEU, a system engineer at iAdvize. I work within the 60 person R&D department in a team of 5 system engineers. Our job is mainly to ensure that applications, services and the underlying system are up and running. We are working with developers to ensure the easiest path for their code to production, and provide the necessary feedback at every step. That’s where monitoring is important.
iAdvize is a full stack conversational commerce platform. We provide an easy way for a brand to centrally interact with their customers, no matter the communication channel (chat, call, video, Facebook Pages, Facebook Messenger, Twitter, Instagram, WhatsApp, SMS, etc...). Our customers work in ecommerce, banks, travel, fashion, etc. in 40 countries . We are an international company of 200 employees with offices in France, UK, Germany, Spain and Italy. We raised $16 Million in 2015.
What was your pre-Prometheus monitoring experience?
I joined iAdvize in February 2016. Previously I worked in companies specialized in network and application monitoring. We were working with opensource software like Nagios , Cacti , Centreon , Zabbix , OpenNMS , etc. and some non-free ones like HP NNM , IBM Netcool suite , BMC Patrol , etc.
iAdvize used to delegate monitoring to an external provider. They ensured 24/7 monitoring using Nagios and Centreon. This toolset was working fine with the legacy static architecture (barebone servers, no VMs, no containers). To complete this monitoring stack, we also use Pingdom .
With the moving our monolithic application towards a Microservices architecture (using Docker) and our will to move our current workload to an infrastructure cloud provider we needed to have more control and flexibility on monitoring. At the same time, iAdvize recruited 3 people, which grew the infrastructure team from 2 to 5. With the old system it took at least a few days or a week to add some new metrics into Centreon and had a real cost (time and money).
Why did you decide to look at Prometheus?
We knew Nagios and the like were not a good choice. Prometheus was the rising star at the time and we decided to PoC it. Sensu was also on the list at the beginning but Prometheus seemed more promising for our use cases.
We needed something able to integrate with Consul, our service discovery system. Our micro services already had a /health route; adding a /metrics endpoint was simple. For about every tool we used, an exporter was available (MySQL, Memcached, Redis, nginx, FPM, etc.).
On paper it looked good.
How did you transition?
First of all, we had to convince the developers team (40 people) that Prometheus was the right tool for the job and that they had to add an exporter to their apps. So we did a little demo on RabbitMQ, we installed a RabbitMQ exporter and built a simple Grafana dashboard to display usage metrics to developers. A Python script was written to create some queue and publish/consume messages.
They were quite impressed to see queues and the messages appear in real time. Before that, developers didn't have access to any monitoring data. Centreon was restricted by our infrastructure provider. Today, Grafana is available to everyone at iAdvize, using the Google Auth integration to authenticate. There are 78 active accounts on it (from dev teams to the CEO).
After we started monitoring existing services with Consul and cAdvisor, we monitored the actual presence of the containers. They were monitored using Pingdom checks but it wasn't enough.
We developed a few custom exporters in Go to scrape some business metrics from our databases (MySQL and Redis).
Soon enough, we were able to replace all the legacy monitoring by Prometheus.
What improvements have you seen since switching?
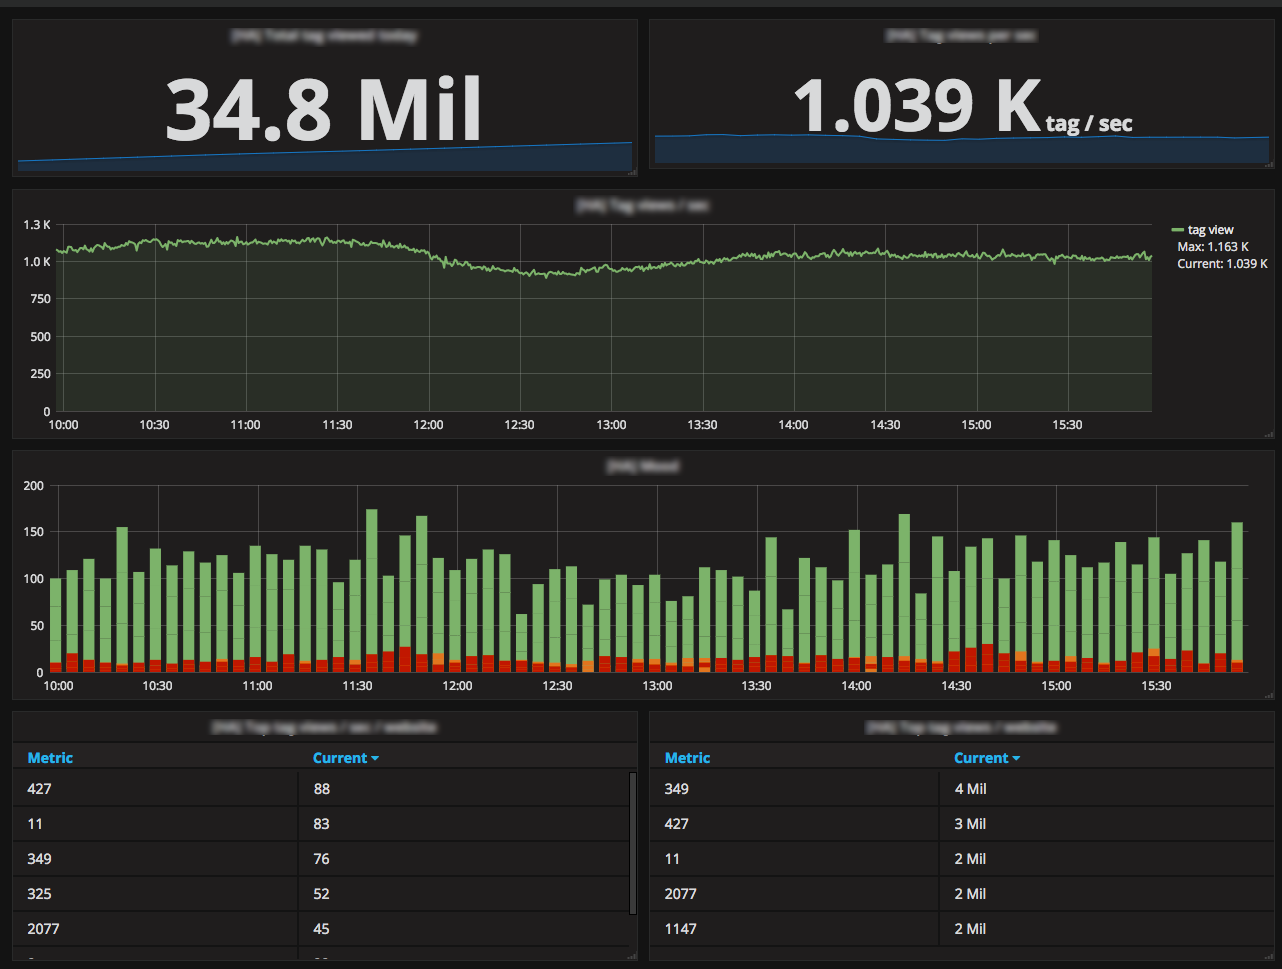
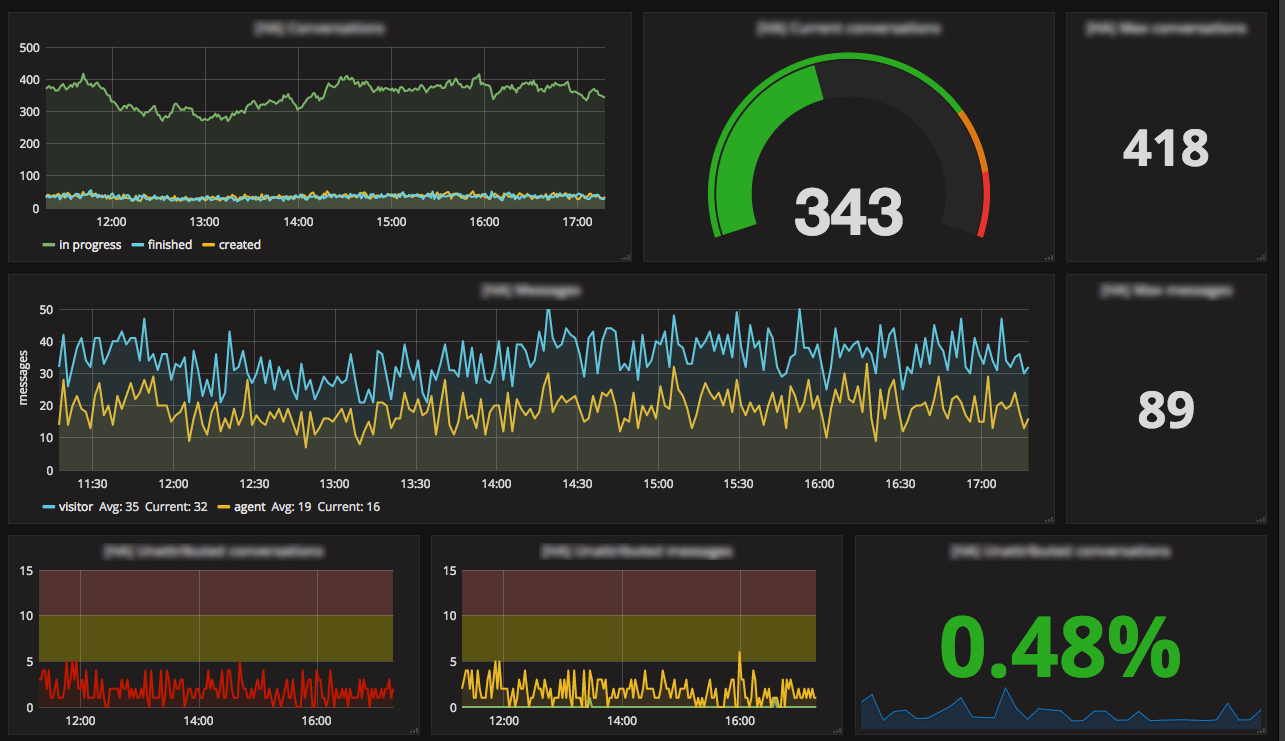
Business metrics became very popular and during sales periods everyone is connected to Grafana to see if we're gonna beat some record. We monitor the number of simultaneous conversations, routing errors, agents connected, the number of visitors loading the iAdvize tag, calls on our API gateway, etc.
We worked for a month to optimize our MySQL servers with analysis based on the Newrelic exporter and [Percona dashboard for grafana] (https://github.com/percona/grafana-dashboards ). It was a real success, allowing us to discover inefficiencies and perform optimisations that cut database size by 45% and peak latency by 75%.
There are a lot to say. We know if a AMQP queue has no consumer or if it is Filling abnormally. We know when a container restarts.
The visibility is just awesome.
That was just for the legacy platform.
More and more micro services are going to be deployed in the cloud and Prometheus is used to monitor them. We are using Consul to register the services and Prometheus to discover the metrics routes. Everything works like a charm and we are able to build a Grafana dashboard with a lot of critical business, application and system metrics.
We are building a scalable architecture to deploy our services with Nomad . Nomad registers healthy services in Consul and with some tags relabeling we are able to filter those with a tag name "metrics=true". It offers to us a huge gain in time to deploy the monitoring. We have nothing to do ^^.
We also use the EC2 service discovery. It's really useful with auto-scaling groups. We scale and recycle instances and it's already monitored. No more waiting for our external infrastructure provider to notice what happens in production.
We use alertmanager to send some alerts by SMS or in to our Flowdock .
What do you think the future holds for iAdvize and Prometheus?
- We are waiting for a simple way to add a long term scalable storage for our capacity planning.
- We have a dream that one day, our auto-scaling will be triggered by Prometheus alerting. We want to build an autonomous system base on response time and business metrics.
- I used to work with Netuitive , it had a great anomaly detection feature with automatic correlation. It would be great to have some in Prometheus.