Monitoring Docker container metrics using cAdvisor
cAdvisor (short for container Advisor) analyzes and exposes resource usage and performance data from running containers. cAdvisor exposes Prometheus metrics out of the box. In this guide, we will:
- create a local multi-container Docker Compose installation that includes containers running Prometheus, cAdvisor, and a Redis server, respectively
- examine some container metrics produced by the Redis container, collected by cAdvisor, and scraped by Prometheus
Prometheus configuration
First, you'll need to configure Prometheus to scrape metrics from cAdvisor. Create a prometheus.yml file and populate it with this configuration:
scrape_configs:
- job_name: cadvisor
  scrape_interval: 5s
  static_configs:
  - targets:
    - cadvisor:8080
Docker Compose configuration
Now we'll need to create a Docker Compose configuration that specifies which containers are part of our installation as well as which ports are exposed by each container, which volumes are used, and so on.
In the same folder where you created the prometheus.yml file, create a docker-compose.yml file and populate it with this Docker Compose configuration:
Using Bind Mounts
version: '3.2'
services:
  prometheus:
    image: prom/prometheus:latest
    container_name: prometheus
    ports:
    - 9090:9090
    command:
    - --config.file=/etc/prometheus/prometheus.yml
    volumes:
    - ./prometheus.yml:/etc/prometheus/prometheus.yml:ro
    depends_on:
    - cadvisor
  cadvisor:
    image: gcr.io/cadvisor/cadvisor:latest
    container_name: cadvisor
    ports:
    - 8080:8080
    volumes:
    - /:/rootfs:ro
    - /var/run:/var/run:rw
    - /sys:/sys:ro
    - /var/lib/docker/:/var/lib/docker:ro
    depends_on:
    - redis
  redis:
    image: redis:latest
    container_name: redis
    ports:
    - 6379:6379
This configuration instructs Docker Compose to run three services, each of which corresponds to a Docker container:
- The
prometheusservice uses the localprometheus.ymlconfiguration file (imported into the container by thevolumesparameter). - The
cadvisorservice exposes port 8080 (the default port for cAdvisor metrics) and relies on a variety of local volumes (/,/var/run, etc.). - The
redisservice is a standard Redis server. cAdvisor will gather container metrics from this container automatically, i.e. without any further configuration.
To run the installation:
docker-compose upIf Docker Compose successfully starts up all three containers, you should see output like this:
prometheus | level=info ts=2018-07-12T22:02:40.5195272Z caller=main.go:500 msg="Server is ready to receive web requests."
You can verify that all three containers are running using the ps command:
docker-compose psYour output will look something like this:
   Name                 Command               State           Ports
----------------------------------------------------------------------------
cadvisor     /usr/bin/cadvisor -logtostderr   Up      8080/tcp
prometheus   /bin/prometheus --config.f ...   Up      0.0.0.0:9090->9090/tcp
redis        docker-entrypoint.sh redis ...   Up      0.0.0.0:6379->6379/tcp
Alternative: Using Inline Docker Configs (Remote Deployments)
If you're managing a remote Docker host and prefer to keep all configuration within the docker-compose.yml file (avoiding the need to manage separate config files on the host), you can use Docker's configs feature:
version: '3.8'

configs:
  prometheus_config:
    content: |
      scrape_configs:
        - job_name: 'cadvisor'
          scrape_interval: 5s
          static_configs:
            - targets: ['cadvisor:8080']

services:
  prometheus:
    image: prom/prometheus:latest
    container_name: prometheus
    ports:
      - 9090:9090
    command:
      - --config.file=/etc/prometheus/prometheus.yml
    configs:
      - source: prometheus_config
        target: /etc/prometheus/prometheus.yml
        uid: "65534"    # Required: numeric UID for 'nobody' user
        gid: "65534"    # Required: numeric GID for 'nobody' group
        mode: 0400      # Required: read-only permissions
    depends_on:
      - cadvisor

  cadvisor:
    image: gcr.io/cadvisor/cadvisor:latest
    container_name: cadvisor
    ports:
      - 8080:8080
    volumes:
      - /:/rootfs:ro
      - /var/run:/var/run:rw
      - /sys:/sys:ro
      - /var/lib/docker/:/var/lib/docker:ro
    depends_on:
      - redis

  redis:
    image: redis:latest
    container_name: redis
    ports:
      - 6379:6379
Important Notes
⚠️ Required Fields: When using Docker configs, you must explicitly specify uid, gid, and mode as numeric values:
uid: "65534"- The numeric user ID (65534 =nobodyuser in the Prometheus image)gid: "65534"- The numeric group ID (65534 =nobodygroup)mode: 0400- File permissions (read-only for owner)
Omitting these fields or using string values like "nobody" will cause the following error:
strconv.Atoi: parsing "nobody": invalid syntax
Exploring the cAdvisor web UI
You can access the cAdvisor web UI at http://localhost:8080. You can explore stats and graphs for specific Docker containers in our installation at http://localhost:8080/docker/<container>. Metrics for the Redis container, for example, can be accessed at http://localhost:8080/docker/redis, Prometheus at http://localhost:8080/docker/prometheus, and so on.
Exploring metrics in the expression browser
cAdvisor's web UI is a useful interface for exploring the kinds of things that cAdvisor monitors, but it doesn't provide an interface for exploring container metrics. For that we'll need the Prometheus expression browser, which is available at http://localhost:9090/graph. You can enter Prometheus expressions into the expression bar, which looks like this:
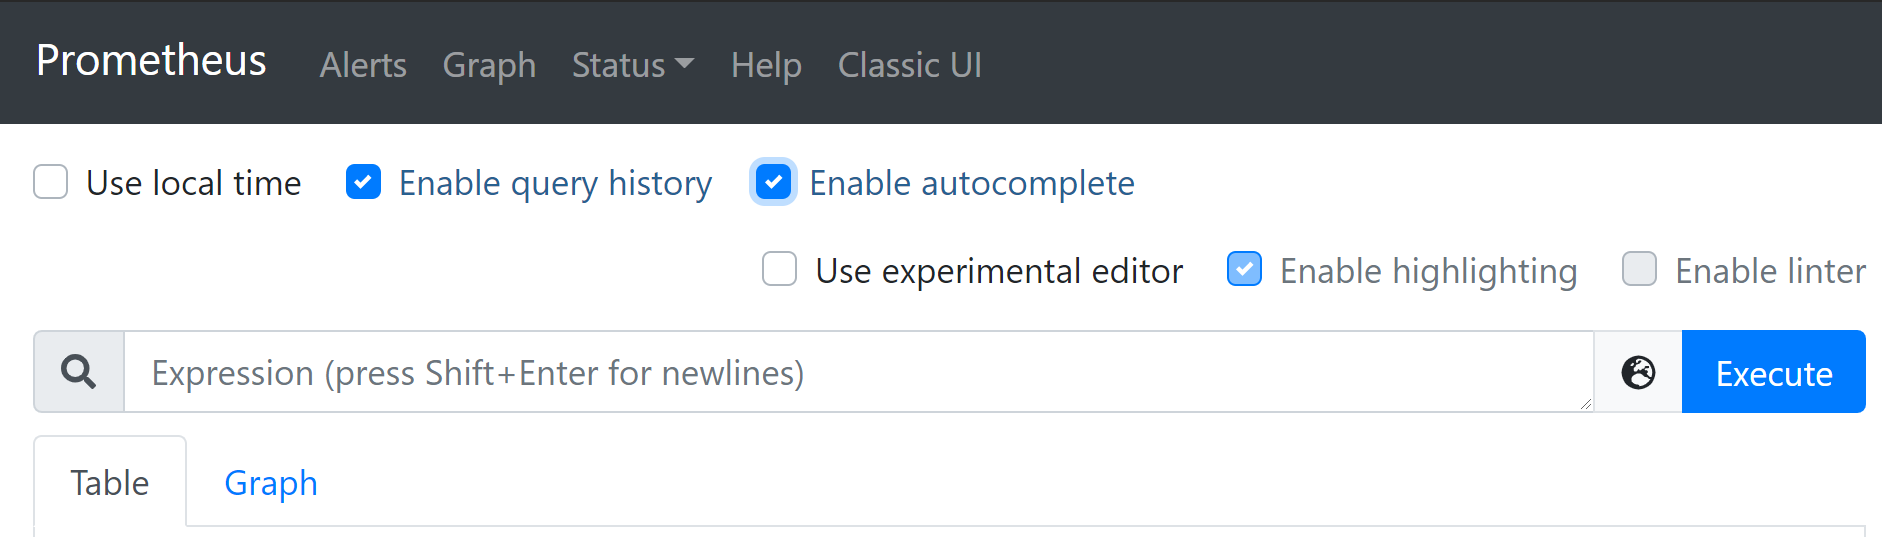
Let's start by exploring the container_start_time_seconds metric, which records the start time of containers (in seconds). You can select for specific containers by name using the name="<container_name>" expression. The container name corresponds to the container_name parameter in the Docker Compose configuration. The container_start_time_seconds{name="redis"} expression, for example, shows the start time for the redis container.
NOTE: A full listing of cAdvisor-gathered container metrics exposed to Prometheus can be found in the cAdvisor documentation .
Other expressions
The table below lists some other example expressions
| Expression | Description | For |
|---|---|---|
rate(container_cpu_usage_seconds_total{name="redis"}[1m]) | The cgroup 's CPU usage in the last minute | The redis container |
container_memory_usage_bytes{name="redis"} | The cgroup's total memory usage (in bytes) | The redis container |
rate(container_network_transmit_bytes_total[1m]) | Bytes transmitted over the network by the container per second in the last minute | All containers |
rate(container_network_receive_bytes_total[1m]) | Bytes received over the network by the container per second in the last minute | All containers |
Summary
In this guide, we ran three separate containers in a single installation using Docker Compose: a Prometheus container scraped metrics from a cAdvisor container which, in turns, gathered metrics produced by a Redis container. We then explored a handful of cAdvisor container metrics using the Prometheus expression browser.