Monitoring Linux host metrics with the Node Exporter
The Prometheus Node Exporter exposes a wide variety of hardware- and kernel-related metrics.
In this guide, you will:
- Start up a Node Exporter on
localhost - Start up a Prometheus instance on
localhostthat's configured to scrape metrics from the running Node Exporter
NOTE: While the Prometheus Node Exporter is for *nix systems, there is the Windows exporter for Windows that serves an analogous purpose.
Installing and running the Node Exporter
The Prometheus Node Exporter is a single static binary that you can install via tarball. Once you've downloaded it from the Prometheus downloads page extract it, and run it:
# NOTE: Replace the URL with one from the above mentioned "downloads" page.
# Node Exporter is available for multiple OS targets and architectures.
# Downloads are available at:
# https://github.com/prometheus/node_exporter/releases/download/v<VERSION>/node_exporter-<VERSION>.<OS>-<ARCH>.tar.gz
#
# <VERSION>, <OS>, and <ARCH> are placeholders:
# - <VERSION>: Release version (e.g., 1.10.2)
# - <OS>: Operating system (e.g., linux, darwin, freebsd)
# - <ARCH>: Architecture (e.g., amd64, arm64, 386)
#
# For this example, we will use Node Exporter version 1.10.2 for a Linux system with amd64 architecture.

wget https://github.com/prometheus/node_exporter/releases/download/v1.10.2/node_exporter-1.10.2.linux-amd64.tar.gz
tar xvfz node_exporter-1.10.2.linux-amd64.tar.gz
cd node_exporter-1.10.2.linux-amd64
./node_exporter
You should see output like this indicating that the Node Exporter is now running and exposing metrics on port 9100:
INFO[0000] Starting node_exporter (version=0.16.0, branch=HEAD, revision=d42bd70f4363dced6b77d8fc311ea57b63387e4f)  source="node_exporter.go:82"
INFO[0000] Build context (go=go1.9.6, user=root@a67a9bc13a69, date=20180515-15:53:28)  source="node_exporter.go:83"
INFO[0000] Enabled collectors:                           source="node_exporter.go:90"
INFO[0000]  - boottime                                   source="node_exporter.go:97"
...
INFO[0000] Listening on :9100                            source="node_exporter.go:111"
Node Exporter metrics
Once the Node Exporter is installed and running, you can verify that metrics are being exported by cURLing the /metrics endpoint:
curl http://localhost:9100/metricsYou should see output like this:
# HELP go_gc_duration_seconds A summary of the GC invocation durations.
# TYPE go_gc_duration_seconds summary
go_gc_duration_seconds{quantile="0"} 3.8996e-05
go_gc_duration_seconds{quantile="0.25"} 4.5926e-05
go_gc_duration_seconds{quantile="0.5"} 5.846e-05
# etc.
Success! The Node Exporter is now exposing metrics that Prometheus can scrape, including a wide variety of system metrics further down in the output (prefixed with node_). To view those metrics (along with help and type information):
curl http://localhost:9100/metrics | grep "node_"Configuring your Prometheus instances
Your locally running Prometheus instance needs to be properly configured in order to access Node Exporter metrics. The following prometheus.yml example configuration file will tell the Prometheus instance to scrape, and how frequently, from the Node Exporter via localhost:9100:
global:
  scrape_interval: 15s

scrape_configs:
- job_name: node
  static_configs:
  - targets: ['localhost:9100']
To install Prometheus, download the latest release for your platform and untar it:
wget https://github.com/prometheus/prometheus/releases/download/v*/prometheus-*.*-amd64.tar.gz
tar xvf prometheus-*.*-amd64.tar.gz
cd prometheus-*.*
Once Prometheus is installed you can start it up, using the --config.file flag to point to the Prometheus configuration that you created above:
./prometheus --config.file=./prometheus.ymlExploring Node Exporter metrics through the Prometheus expression browser
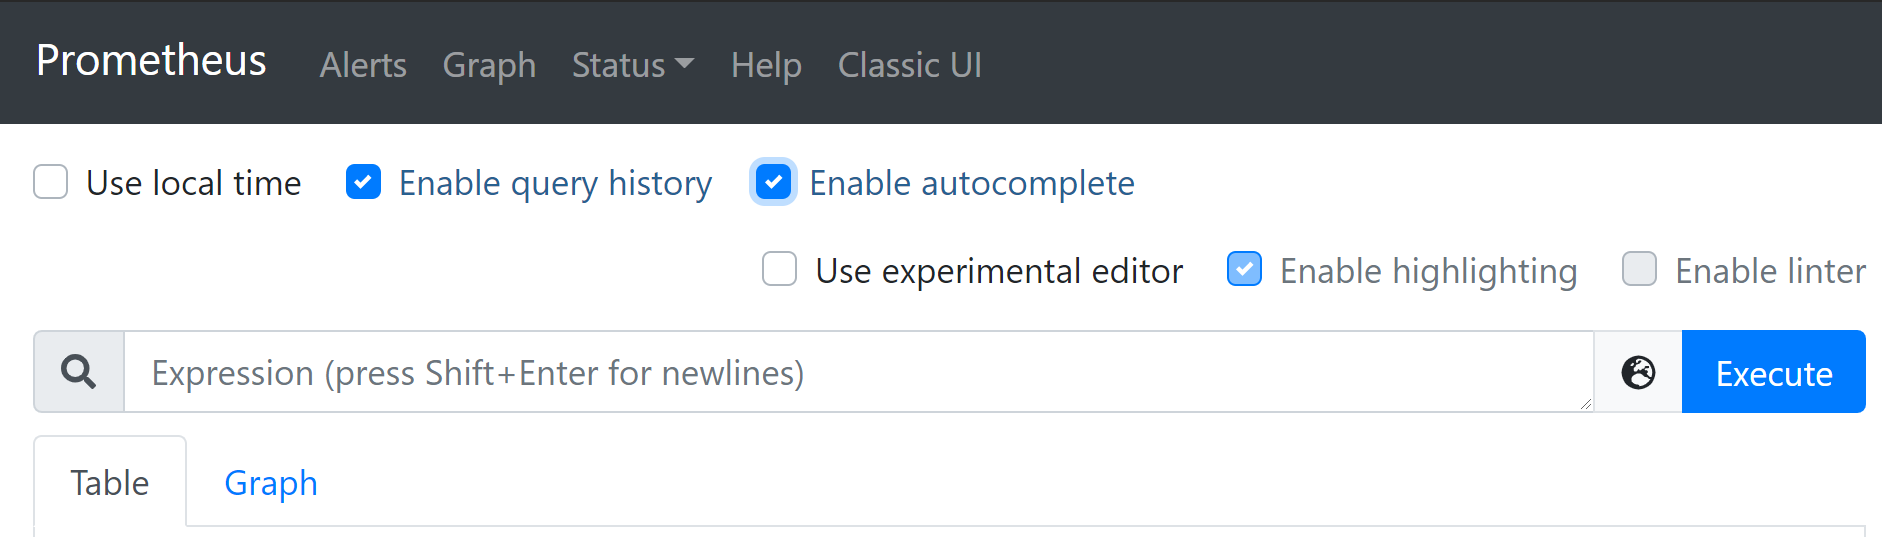
Now that Prometheus is scraping metrics from a running Node Exporter instance, you can explore those metrics using the Prometheus UI (aka the expression browser). Navigate to localhost:9090/graph in your browser and use the main expression bar at the top of the page to enter expressions. The expression bar looks like this:
Metrics specific to the Node Exporter are prefixed with node_ and include metrics like node_cpu_seconds_total and node_exporter_build_info.
Click on the links below to see some example metrics:
| Metric | Meaning |
|---|---|
rate(node_cpu_seconds_total{mode="system"}[1m]) | The average amount of CPU time spent in system mode, per second, over the last minute (in seconds) |
node_filesystem_avail_bytes | The filesystem space available to non-root users (in bytes) |
rate(node_network_receive_bytes_total[1m]) | The average network traffic received, per second, over the last minute (in bytes) |