Announcing Prometheus 3.0
November 14, 2024 by The Prometheus Team
Following the recent release of Prometheus 3.0 beta at PromCon in Berlin, the Prometheus Team is excited to announce the immediate availability of Prometheus Version 3.0!
This latest version marks a significant milestone as it is the first major release in 7 years. Prometheus has come a long way in that time, evolving from a project for early adopters to becoming a standard part of the cloud native monitoring stack. Prometheus 3.0 aims to continue that journey by adding some exciting new features while largely maintaining stability and compatibility with previous versions.
The full 3.0 release adds some new features on top of the beta and also introduces a few additional breaking changes that we will describe in this article.
What's New
Here is a summary of the exciting changes that have been released as part of the beta version, as well as what has been added since:
New UI
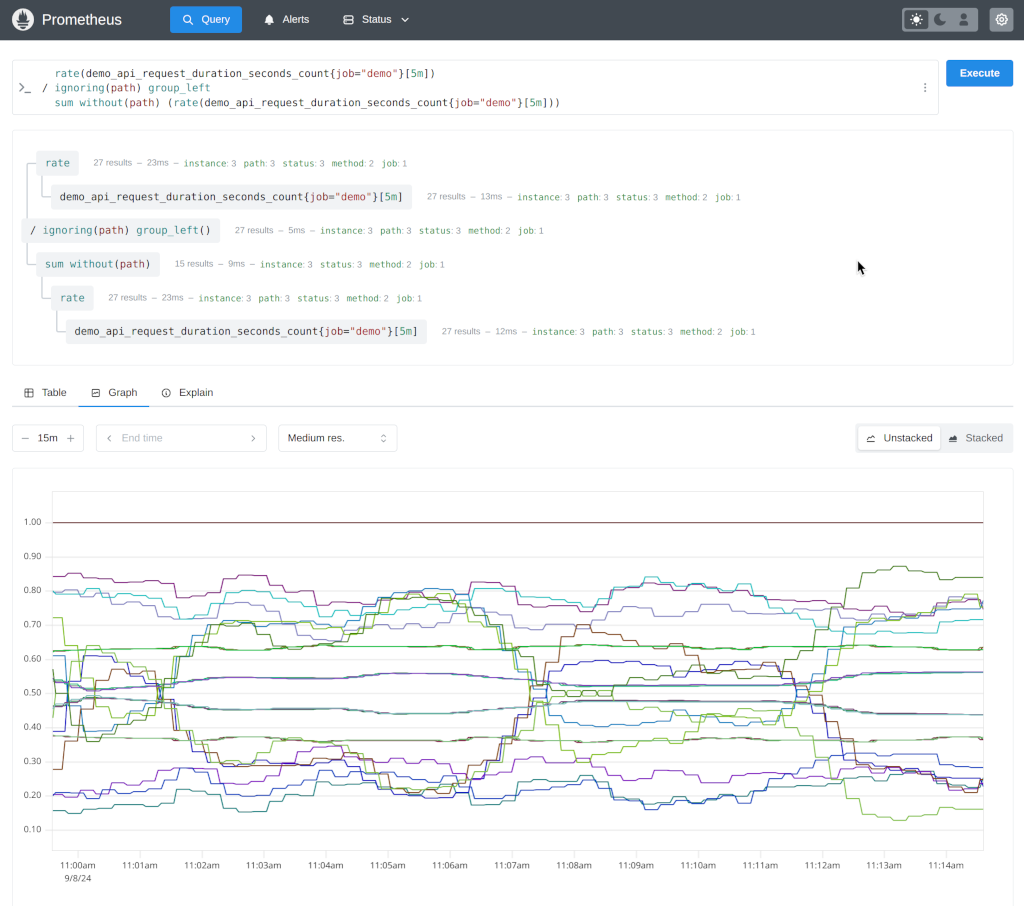
One of the highlights in Prometheus 3.0 is its brand-new UI that is enabled by default:

The UI has been completely rewritten with less clutter, a more modern look and feel, new features like a PromLens-style tree view, and will make future maintenance easier by using a more modern technical stack.
Learn more about the new UI in general in Julius' detailed article on the PromLabs blog .
Users can temporarily enable the old UI by using the old-ui feature flag.
Since the new UI is not battle-tested yet, it is also very possible that there are still bugs. If you find any, please report them on GitHub .
Since the beta, the user interface has been updated to support UTF-8 metric and label names.

Remote Write 2.0
Remote-Write 2.0 iterates on the previous protocol version by adding native support for a host of new elements including metadata, exemplars, created timestamp and native histograms. It also uses string interning to reduce payload size and CPU usage when compressing and decompressing. There is better handling for partial writes to provide more details to clients when this occurs. More details can be found here.
UTF-8 Support
Prometheus now allows all valid UTF-8 characters to be used in metric and label names by default, as well as label values, as has been true in version 2.x.
Users will need to make sure their metrics producers are configured to pass UTF-8 names, and if either side does not support UTF-8,
metric names will be escaped using the traditional underscore-replacement method. PromQL queries can be written with the new quoting syntax
in order to retrieve UTF-8 metrics, or users can specify the __name__ label name manually.
Currently only the Go client library has been updated to support UTF-8, but support for other languages will be added soon.
OTLP Support
In alignment with our commitment to OpenTelemetry, Prometheus 3.0 features several new features to improve interoperability with OpenTelemetry.
OTLP Ingestion
Prometheus can be configured as a native receiver for the OTLP Metrics protocol, receiving OTLP metrics on the /api/v1/otlp/v1/metrics endpoint.
See our guide on best practices for consuming OTLP metric traffic into Prometheus.
UTF-8 Normalization
With Prometheus 3.0, thanks to UTF-8 support, users can store and query OpenTelemetry metrics without annoying changes to metric and label names like changing dots to underscores .
Notably this allows less confusion for users and tooling in terms of the discrepancy between what’s defined in OpenTelemetry semantic convention or SDK and what’s actually queryable.
To achieve this for OTLP ingestion, Prometheus 3.0 has experimental support for different translation strategies. See otlp section in the Prometheus configuration for details.
NOTE: While “NoUTF8EscapingWithSuffixes” strategy allows special characters, it still adds required suffixes for the best experience. See the proposal on the future work to enable no suffixes in Prometheus.
Native Histograms
Native histograms are a Prometheus metric type that offer a higher efficiency and lower cost alternative to Classic Histograms. Rather than having to choose (and potentially have to update) bucket boundaries based on the data set, native histograms have pre-set bucket boundaries based on exponential growth.
Native Histograms are still experimental and not yet enabled by default, and can be turned on by passing --enable-feature=native-histograms. Some aspects of Native Histograms, like the text format and accessor functions / operators are still under active design.
Breaking Changes
The Prometheus community strives to not break existing features within a major release. With a new major release we took the opportunity to clean up a few, but small, long-standing issues. In other words, Prometheus 3.0 contains a few breaking changes. This includes changes to feature flags, configuration files, PromQL, and scrape protocols.
Please read the migration guide to find out if your setup is affected and what actions to take.
Performance
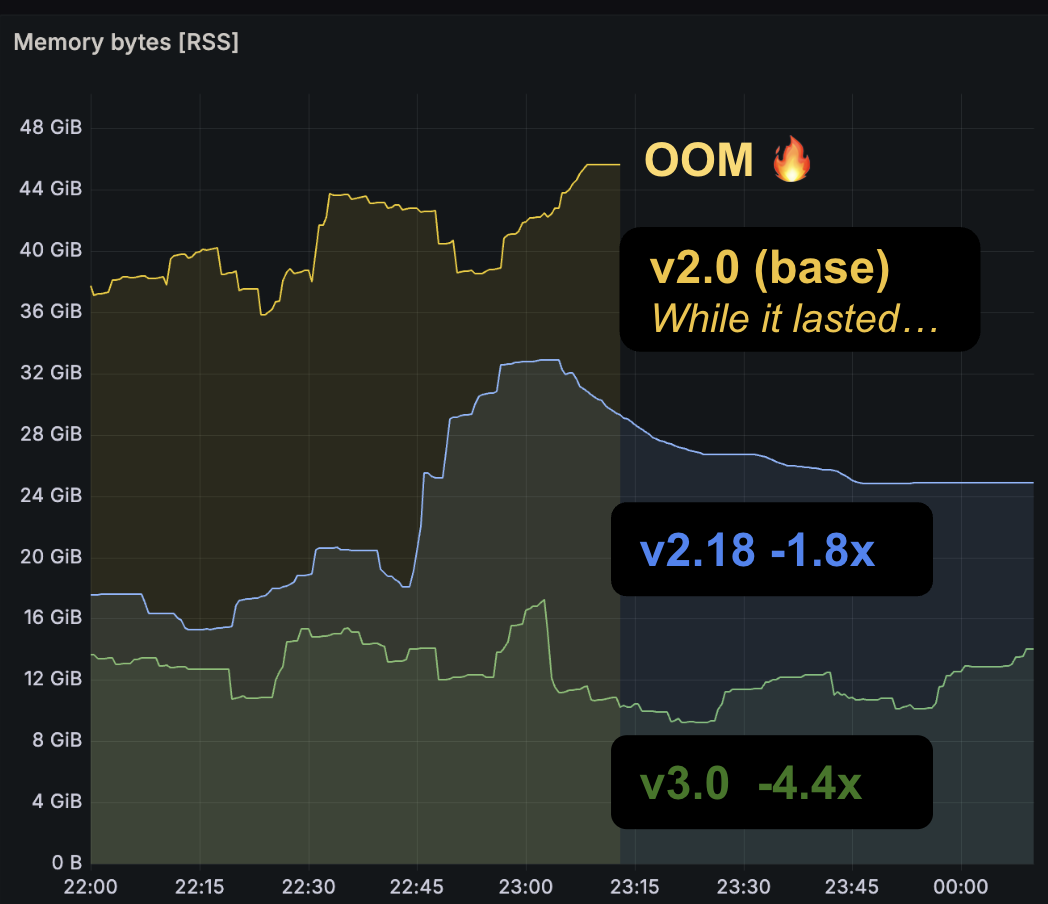
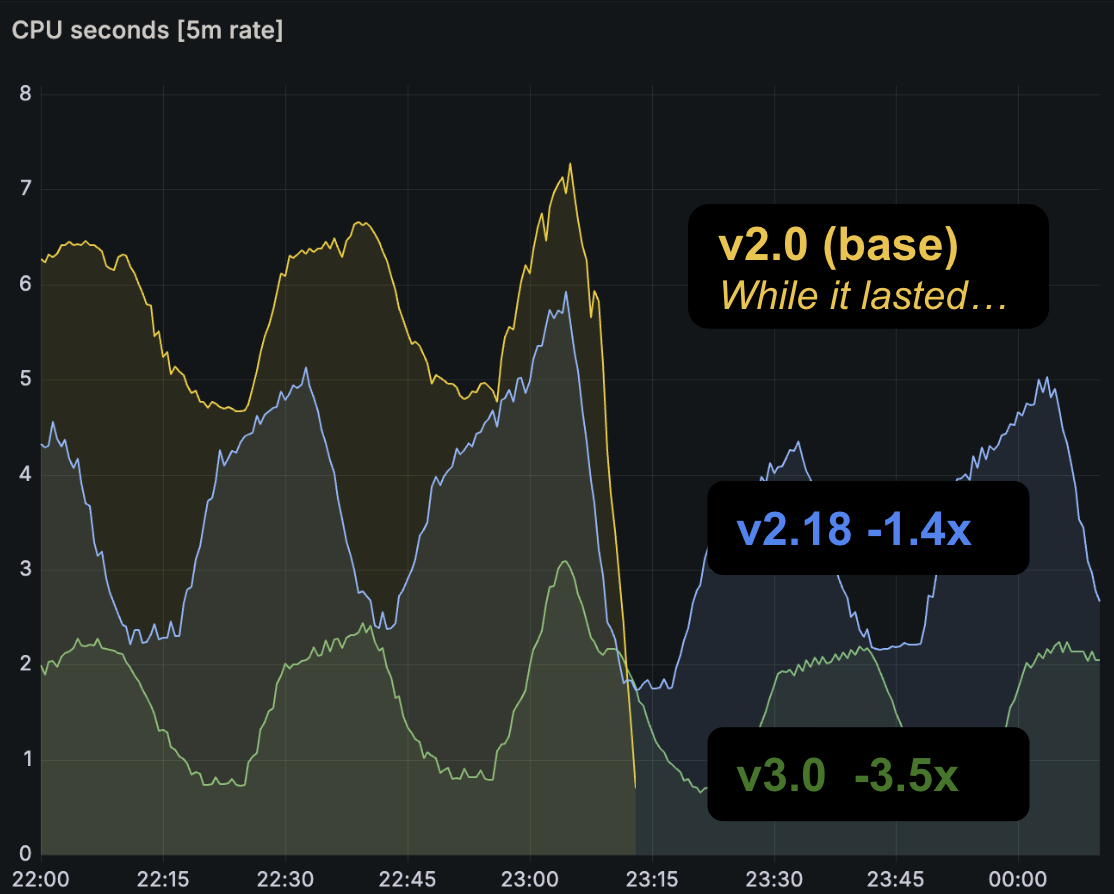
It’s impressive to see what we have accomplished in the community since Prometheus 2.0. We all love numbers, so let’s celebrate the efficiency improvements we made for both CPU and memory use for the TSDB mode. Below you can see performance numbers between 3 Prometheus versions on the node with 8 CPU and 49 GB allocatable memory.
- 2.0.0 (7 years ago)
- 2.18.0 (4 years ago)
- 3.0.0 (now)


It’s furthermore impressive that those numbers were taken using our prombench macrobenchmark that uses the same PromQL queries, configuration and environment–highlighting backward compatibility and stability for the core features, even with 3.0.
What's Next
There are still tons of exciting features and improvements we can make in Prometheus and the ecosystem. Here is a non-exhaustive list to get you excited and… hopefully motivate you to contribute and join us!
- New, more inclusive governance
- More OpenTelemetry compatibility and features
- OpenMetrics 2.0, now under Prometheus governance!
- Native Histograms stability (and with custom buckets!)
- More optimizations!
- UTF-8 support coverage in more SDKs and tools
Try It Out!
You can try out Prometheus 3.0 by downloading it from our official binaries and container images .
If you are upgrading from Prometheus 2.x, check out the migration guide for more information on any adjustments you will have to make. Please note that we strongly recommend upgrading to v2.55 before upgrading to v3.0. Rollback is possible from v3.0 to v2.55, but not to earlier versions.
As always, we welcome feedback and contributions from the community!
