Prometheus 3.0 Beta Released
September 11, 2024 by The Prometheus Team
The Prometheus Team is proud to announce the availability of Prometheus Version 3.0-beta! You can download it here . As is traditional with a beta release, we do not recommend users install Prometheus 3.0-beta on critical production systems, but we do want everyone to test it out and find bugs.
In general, the only breaking changes are the removal of deprecated feature flags. The Prometheus team worked hard to ensure backwards-compatibility and not to break existing installations, so all of the new features described below build on top of existing functionality. Most users should be able to try Prometheus 3.0 out of the box without any configuration changes.
What's New
With over 7500 commits in the 7 years since Prometheus 2.0 came out there are too many new individual features and fixes to list, but there are some big shiny and breaking changes we wanted to call out. We need everyone in the community to try them out and report any issues you might find. The more feedback we get, the more stable the final 3.0 release can be.
New UI
One of the highlights in Prometheus 3.0 is its brand new UI that is enabled by default:
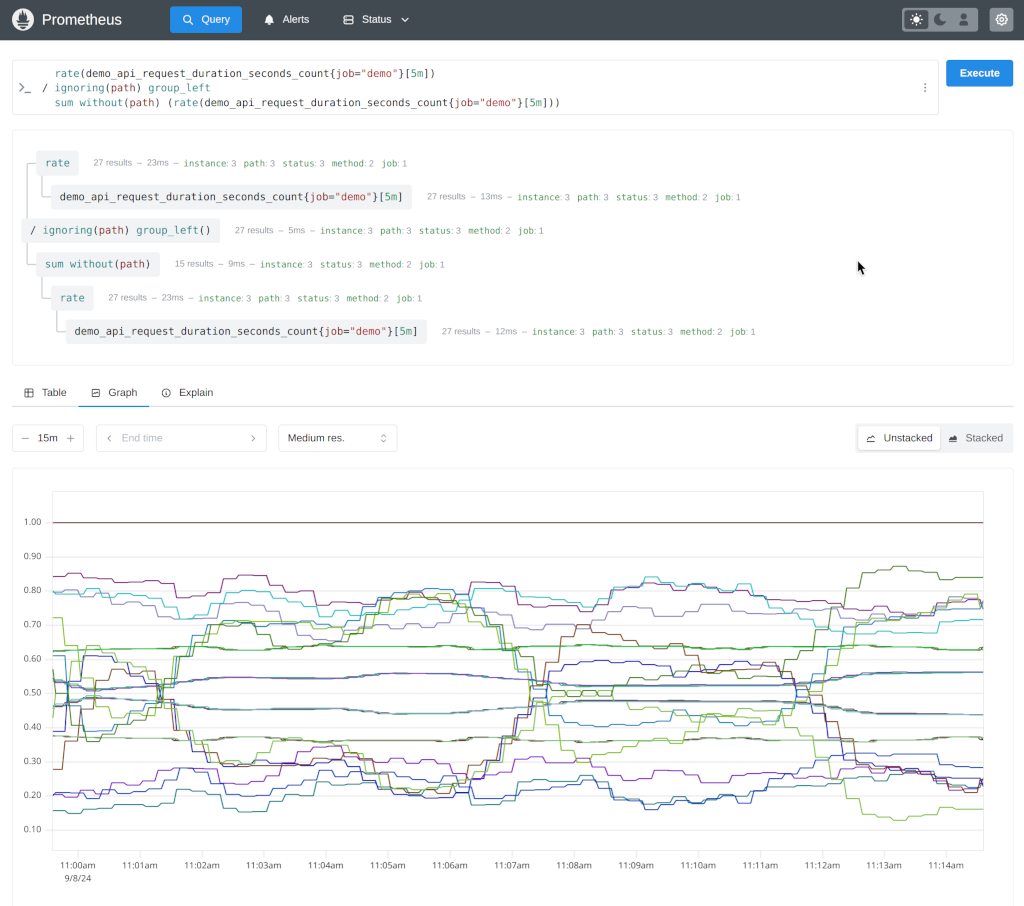
The UI has been completely rewritten with less clutter, a more modern look and feel, new features like a PromLens-style tree view, and will make future maintenance easier by using a more modern technical stack.
Learn more about the new UI in general in Julius' detailed article on the PromLabs blog .
Users can temporarily enable the old UI by using the old-ui feature flag.
Since the new UI is not battle-tested yet, it is also very possible that there are still bugs. If you find any, please report them on GitHub .
Remote Write 2.0
Remote-Write 2.0 iterates on the previous protocol version by adding native support for a host of new elements including metadata, exemplars, created timestamp and native histograms. It also uses string interning to reduce payload size and CPU usage when compressing and decompressing. More details can be found here.
OpenTelemetry Support
Prometheus intends to be the default choice for storing OpenTelemetry metrics, and 3.0 includes some big new features that makes it even better as a storage backend for OpenTelemetry metrics data.
UTF-8
By default, Prometheus will allow all valid UTF-8 characters to be used in metric and label names, as well as label values as has been true in version 2.x.
Users will need to make sure their metrics producers are configured to pass UTF-8 names, and if either side does not support UTF-8, metric names will be escaped using the traditional underscore-replacement method. PromQL queries can be written with the new quoting syntax in order to retrieve UTF-8 metrics, or users can specify the __name__ label name manually.
Not all language bindings have been updated with support for UTF-8 but the primary Go libraries have been.
OTLP Ingestion
Prometheus can be configured as a native receiver for the OTLP Metrics protocol, receiving OTLP metrics on the /api/v1/otlp/v1/metrics endpoint.
Native Histograms
Native histograms are a Prometheus metric type that offer a higher efficiency and lower cost alternative to Classic Histograms. Rather than having to choose (and potentially have to update) bucket boundaries based on the data set, native histograms have pre-set bucket boundaries based on exponential growth.
Native Histograms are still experimental and not yet enabled by default, and can be turned on by passing --enable-feature=native-histograms. Some aspects of Native Histograms, like the text format and accessor functions / operators are still under active design.
Other Breaking Changes
The following feature flags have been removed, being enabled by default instead. References to these flags should be removed from configs, and will be ignored in Prometheus starting with version 3.0
promql-at-modifierpromql-negative-offsetremote-write-receiverno-scrape-default-portnew-service-discovery-manager
Range selections are now left-open and right-closed , which will avoid rare occasions that more points than intended are included in operations.
Agent mode is now stable and has its own config flag instead of a feature flag