Announcing Prometheus 2.0
November 8, 2017 by Fabian Reinartz on behalf of the Prometheus team
Nearly one and a half years ago, we released Prometheus 1.0 into the wild. The release marked a significant milestone for the project. We had reached a broad set of features that make up Prometheus' simple yet extremely powerful monitoring philosophy.
Since then we added and improved on various service discovery integrations, extended PromQL, and experimented with a first iteration on remote APIs to enable pluggable long-term storage solutions.
But what else has changed to merit a new major release?
Prometheus 2.0
Prometheus has a simple and robust operational model that our users quickly learn to love. Yet, the infrastructure space did not stand still and projects like Kubernetes and Mesos rapidly change how software is being deployed and managed. Monitored environments have become increasingly more dynamic.
More and more we felt the strain this put on Prometheus' performance. The storage subsystem required careful configuration for the expected load. Prometheus 1.6 greatly alleviated this pain with its auto-tuning capabilities. Nonetheless, our users were bound to hit some inevitable hard-limits.
Storage
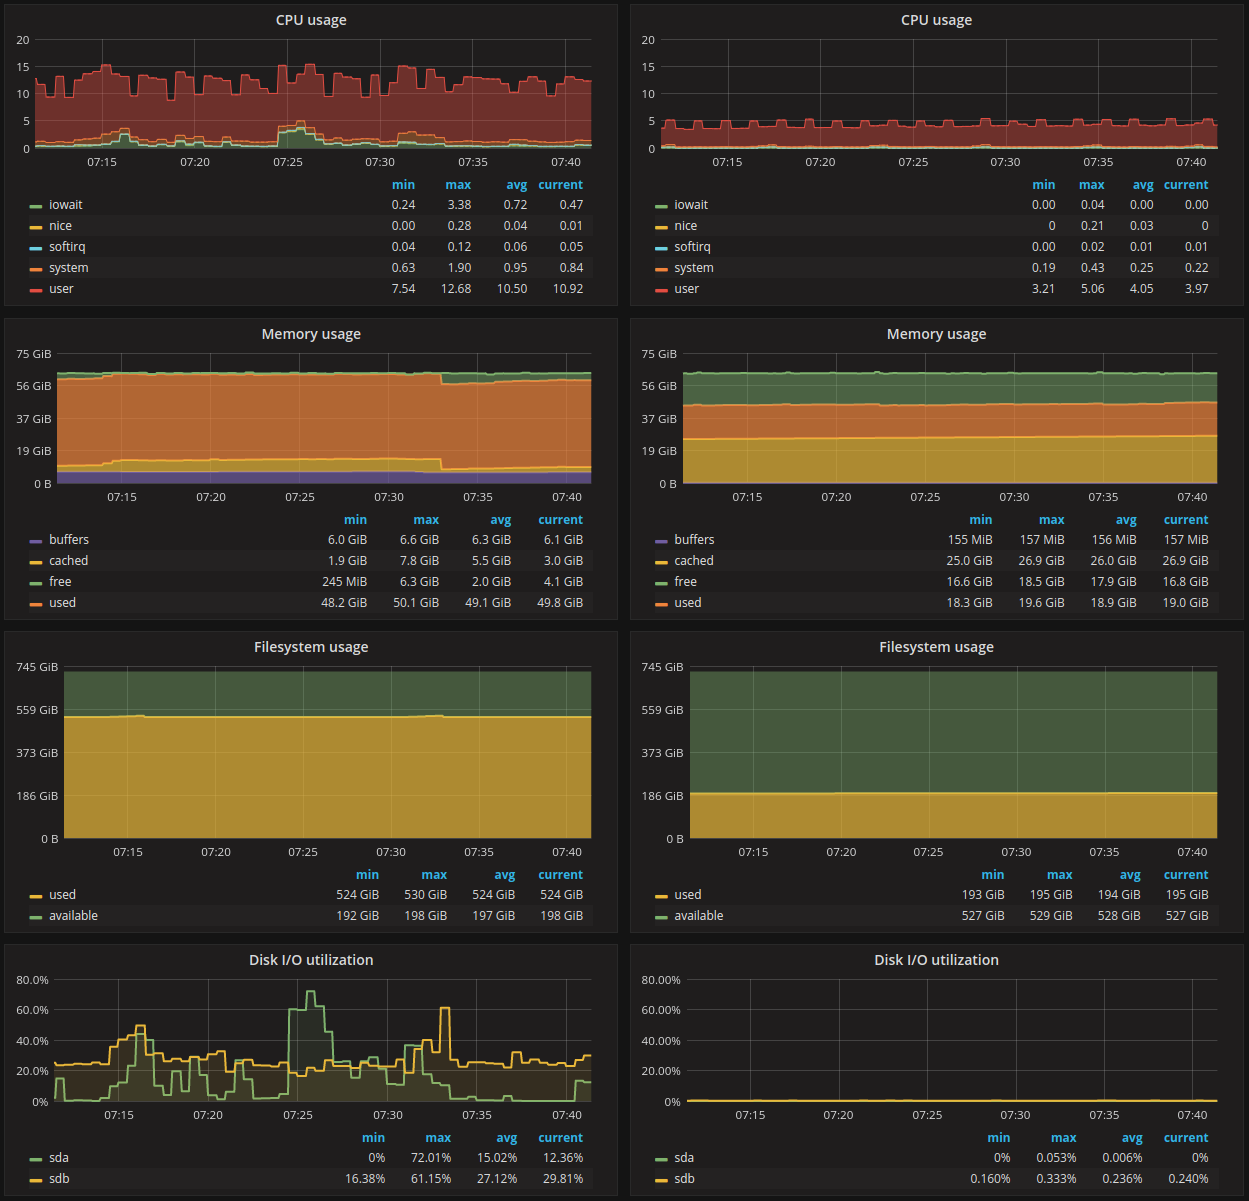
In early 2017, things started moving under the hood. What first began as an experiment for a new, more performant time series database quickly got confirmed in practical benchmarks. Over the past six months we have been busy stabilizing this work as an independent time series database and re-integrating this into Prometheus itself. The result is a significantly better performing Prometheus 2.0 with improvements along virtually all dimensions. Query latency is more consistent and it especially scales better in the face of high series churn. Resource consumption, as measured in different real-world production scenarios, also decreased significantly:
- CPU usage reduced to 20% - 40% compared to Prometheus 1.8
- Disk space usage reduced to 33% - 50% compared to Prometheus 1.8
- Disk I/O without much query load is usually <1% on average

It is also well-equipped to handle the increasingly dynamic characteristics of modern computing environments for years to come.
Staleness handling
Additionally, many small and big changes have happened to make the Prometheus experience more consistent and intuitive. The most notable one is staleness handling , which was one of the oldest and most requested roadmap items. With the new improvements, disappearing monitoring targets or series from those targets are now explicitly tracked, which reduces querying artefacts and increases alerting responsiveness.
Other improvements
Prometheus 2.0 also comes with built-in support for snapshot backups of the entire database .
We also migrated our recording and alerting rules from a custom format to the ubiquitous YAML format. This makes it easier to integrate with configuration management and templating.
A lot of additional smaller changes and cleanups happened. Check the Prometheus 1.x to 2.0 migration guide for a full overview of changes and how to adapt your setup to them. But do not worry, Prometheus 2 is still the Prometheus you have learned to love — just a lot faster and even easier to operate and use.
What's next
The new storage subsystem is designed to be accessible and extensible. This goes for new features directly integrated into Prometheus as well as custom tools that can be built on top of it. The simple and open storage format and library also allows users to easily build custom extensions like dynamic retention policies. This enables the storage layer to meet a wide array of requirements without drawing complexity into Prometheus itself; allowing it to focus on its core goals.
The remote APIs will continue to evolve to satisfy requirements for long-term storage without sacrificing Prometheus' model of reliability through simplicity.
Try it out!
You can try out Prometheus 2.0 as usual by downloading our official binaries and container images . See the Getting started page for a tutorial on how to get up and running with Prometheus.
If you are upgrading from Prometheus 1.x, check our migration guide to learn about adjustments that you will have to make and how to use the remote APIs to read data from old Prometheus servers during the migration period.
Finally, we would like to thank all our users who extensively tested the pre-releases and helped us in debugging issues. This huge milestone would not have been possible without you!
