Interview with Europace
April 6, 2017 by Brian Brazil
Continuing our series of interviews with users of Prometheus, Tobias Gesellchen from Europace talks about how they discovered Prometheus.
Can you tell us about Europace does?
Europace AG develops and operates the web-based EUROPACE financial marketplace, which is Germany’s largest platform for mortgages, building finance products and personal loans. A fully integrated system links about 400 partners – banks, insurers and financial product distributors. Several thousand users execute some 35,000 transactions worth a total of up to €4 billion on EUROPACE every month. Our engineers regularly blog at http://tech.europace.de/ and @EuropaceTech .
What was your pre-Prometheus monitoring experience?
Nagios /Icinga are still in use for other projects, but with the growing number of services and higher demand for flexibility we looked for other solutions. Due to Nagios and Icinga being more centrally maintained, Prometheus matched our aim to have the full DevOps stack in our team and move specific responsibilities from our infrastructure team to the project members.
Why did you decide to look at Prometheus?
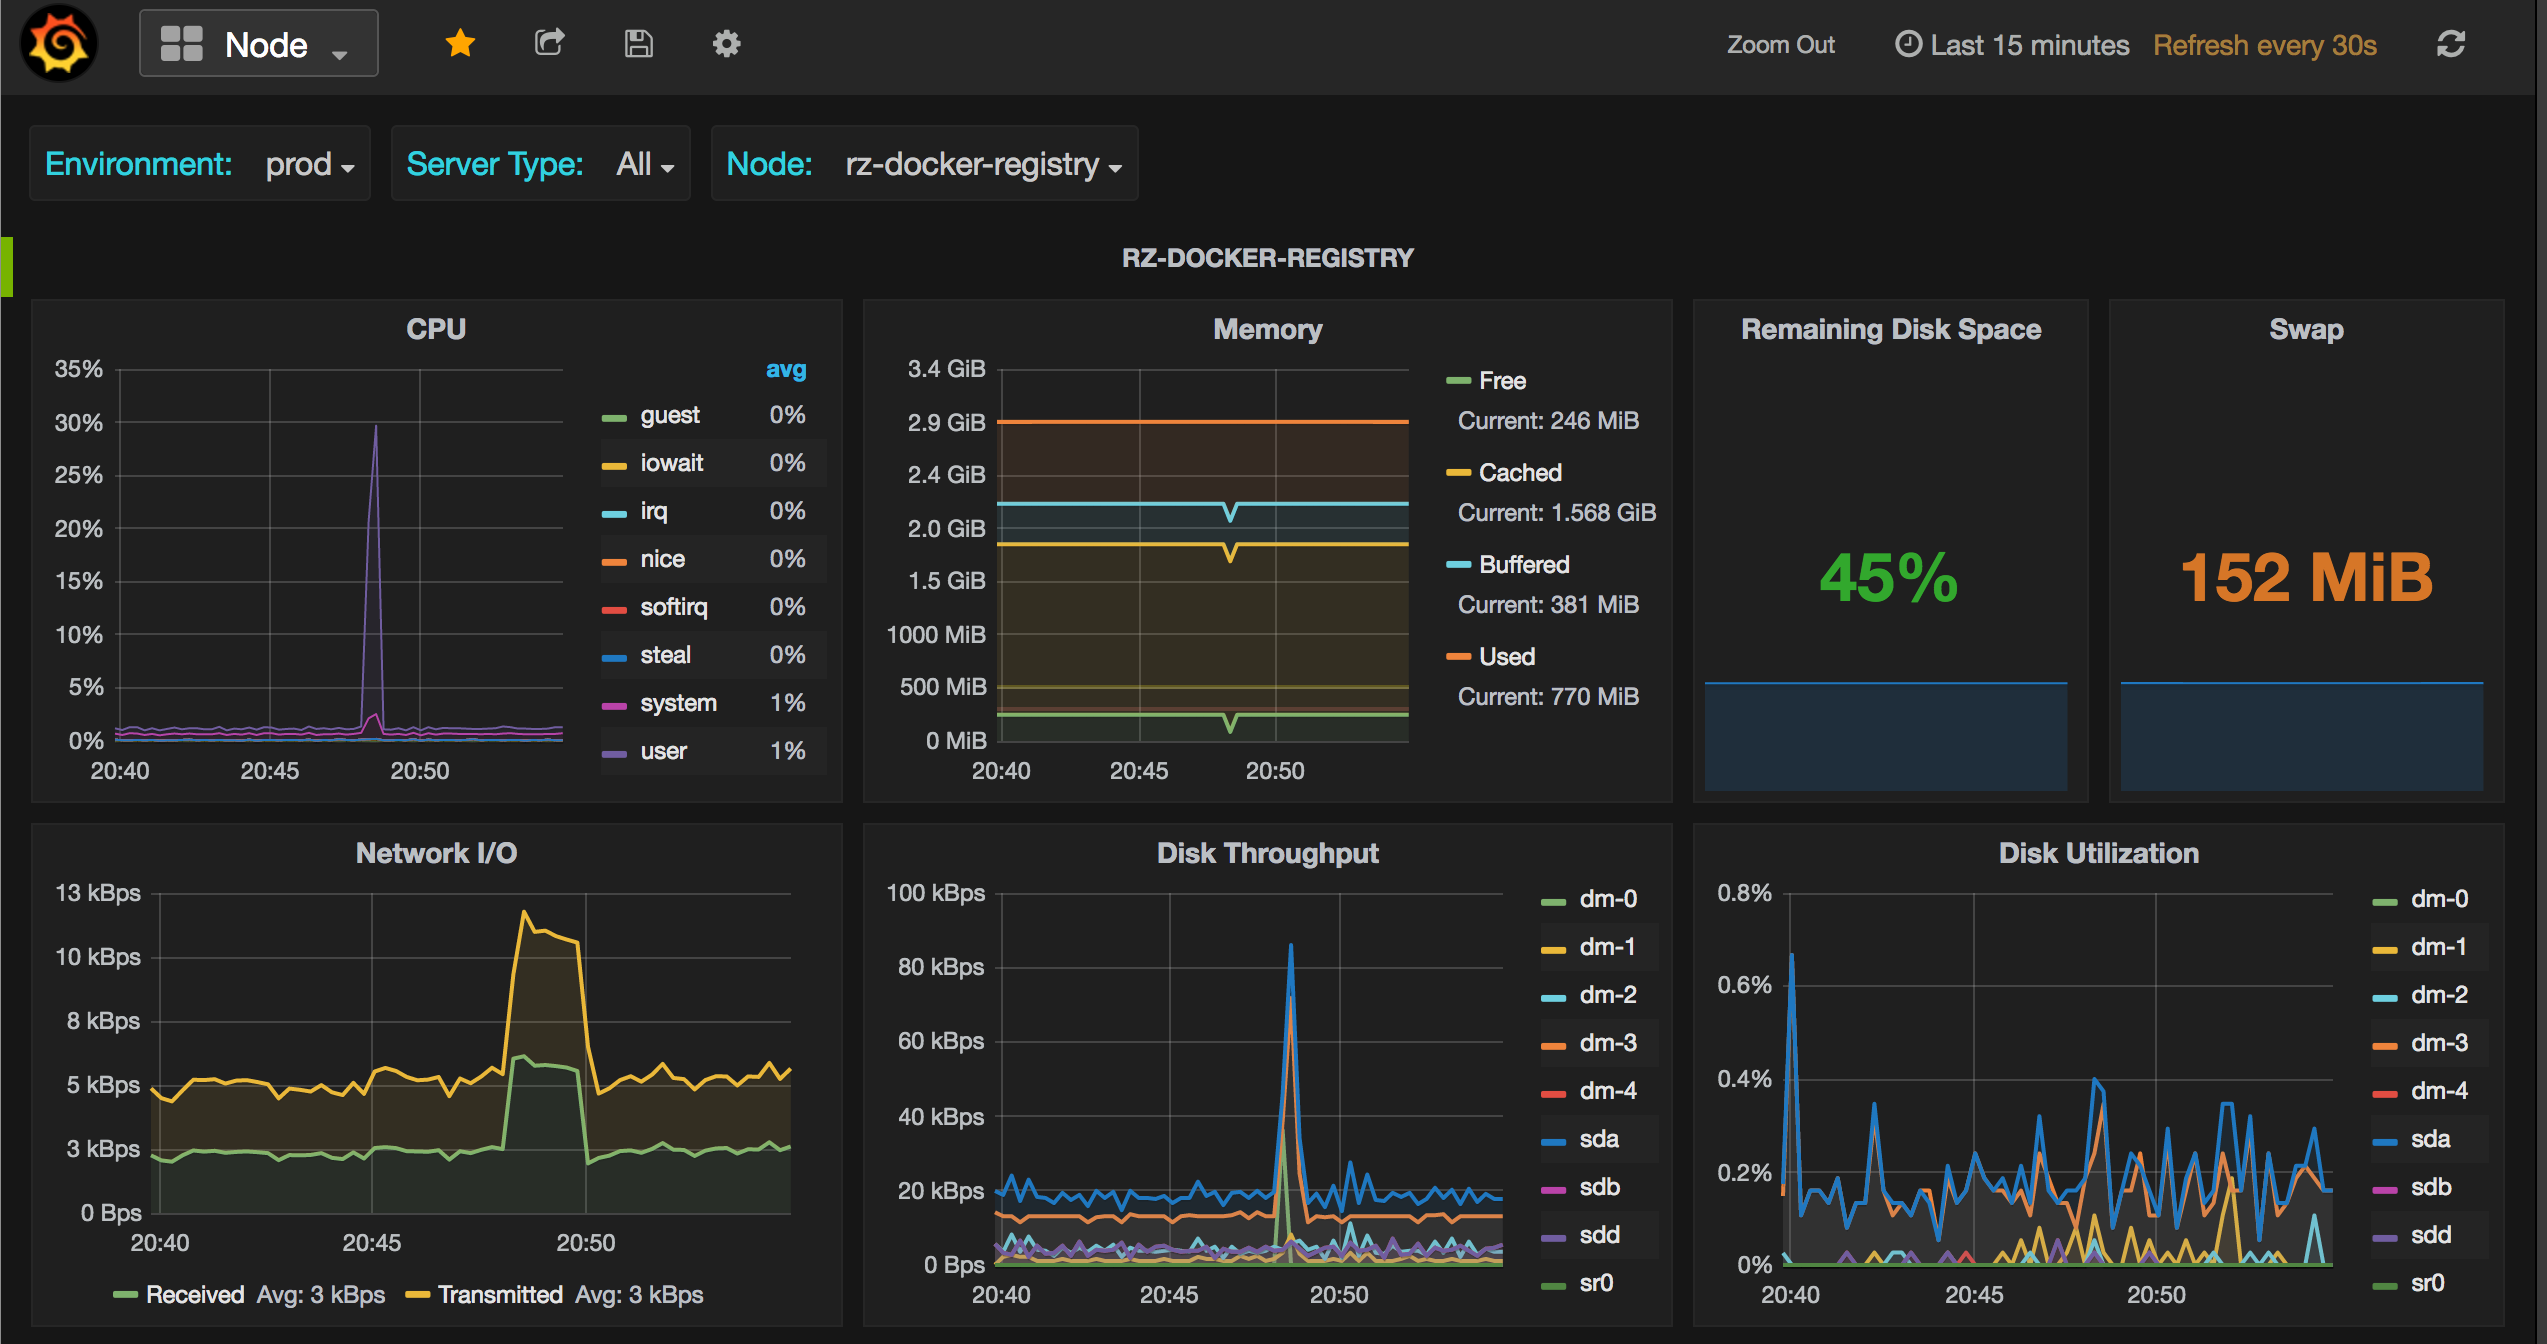
Through our activities in the Docker Berlin community we had been in contact with SoundCloud and Julius Volz , who gave us a good overview. The combination of flexible Docker containers with the highly flexible label-based concept convinced us give Prometheus a try. The Prometheus setup was easy enough, and the Alertmanager worked for our needs, so that we didn’t see any reason to try alternatives. Even our little pull requests to improve the integration in a Docker environment and with messaging tools had been merged very quickly. Over time, we added several exporters and Grafana to the stack. We never looked back or searched for alternatives.

How did you transition?
Our team introduced Prometheus in a new project, so the transition didn’t happen in our team. Other teams started by adding Prometheus side by side to existing solutions and then migrated the metrics collectors step by step. Custom exporters and other temporary services helped during the migration. Grafana existed already, so we didn’t have to consider another dashboard. Some projects still use both Icinga and Prometheus in parallel.
What improvements have you seen since switching?
We had issues using Icinga due to scalability - several teams maintaining a centrally managed solution didn’t work well. Using the Prometheus stack along with the Alertmanager decoupled our teams and projects. The Alertmanager is now able to be deployed in a high availability mode , which is a great improvement to the heart of our monitoring infrastructure.
What do you think the future holds for Europace and Prometheus?
Other teams in our company have gradually adopted Prometheus in their projects. We expect that more projects will introduce Prometheus along with the Alertmanager and slowly replace Icinga. With the inherent flexibility of Prometheus we expect that it will scale with our needs and that we won’t have issues adapting it to future requirements.
